Daily Health Report — Monitor Your Marketing Data Health
The Daily Health Report is an automated email report that gives you a complete snapshot of your marketing data health — every day, without lifting a finger.
It monitors your event data flow, customer profiles, funnel performance, and destination delivery so you can catch issues early and keep your campaigns running smoothly.
What the Report Monitors
Section titled “What the Report Monitors”The Daily Health Report tracks four key areas of your CustomerLabs account:
| Area | What It Tracks |
|---|---|
| Funnel Conversion Rate | How users move through your marketing funnel — from page view to purchase |
| Customer Segmentation | The split between new and repeat customers |
| Profile Unification | How well customer data is being matched across touchpoints and devices |
| Destination Performance | Whether your event data is being delivered successfully to ad platforms |
Why It Matters
Section titled “Why It Matters”Keeping track of your data health is critical for running effective marketing campaigns. The Daily Health Report helps you:
- Detect data flow issues early — spot problems before they affect your campaigns
- Monitor integration health — see if your connected ad platforms (like Facebook or Google Ads) are receiving data correctly
- Identify errors quickly — get alerts when destination delivery failures spike
- Maintain healthy automation — ensure your customer profiles are unified and your funnels are performing as expected
- Track day-over-day trends — compare yesterday’s performance with the day before to spot shifts
What the Report Includes
Section titled “What the Report Includes”Each report is delivered daily via email and contains the following sections:
1. Funnel Conversion Rate
Section titled “1. Funnel Conversion Rate”Shows how users progress through key events in your marketing funnel.
| Column | What It Shows |
|---|---|
| Event Name | Each step in your funnel (e.g., Page View, Product Viewed, Purchase) |
| User Count | Number of unique users at each step |
| Step Conversion Rate | Percentage of users who moved from the previous step to this one |
| Day-over-Day Change | Comparison with the previous day, shown with ▲ or ▼ indicators |
Tip: A sudden drop in step conversion rate may indicate an issue with your product page, checkout flow, or payment system.
2. Customer Segmentation
Section titled “2. Customer Segmentation”Breaks down your customers into New and Repeat segments.
| Metric | What It Shows |
|---|---|
| New | First-time buyers or users |
| Repeat | Returning customers who have purchased before |
| Count | Total number of customers in each segment |
| Percentage | Share of each segment relative to total customers |
3. Profile Unification
Section titled “3. Profile Unification”Shows how well your customer data is being matched across different touchpoints and devices.
| Column | What It Shows |
|---|---|
| Profile Type | Unified or Non-unified |
| Count | Number of profiles in each category |
| Percentage | Share of unified vs. non-unified profiles |
- Unified Profiles — Multiple identifiers (email, phone, device) successfully matched to one customer
- Non-unified Profiles — Profiles that haven’t been linked yet
4. Destination Performance
Section titled “4. Destination Performance”Monitors whether your event data is being delivered successfully to your connected ad platforms.
| Column | What It Shows |
|---|---|
| Destination | The name of the connected platform (e.g., Facebook, Google Ads) |
| Success % | Percentage of events delivered successfully |
| Error % | Percentage of events that failed delivery |
| Warning % | Percentage of events with minor issues |
5. Notes & Guidance
Section titled “5. Notes & Guidance”Each report includes a helpful reference section with quick tips on how to read your funnel data, profile metrics, segmentation insights, and destination health — so your team always knows what to look for.
What You Can Expect
Section titled “What You Can Expect”- Daily delivery — The report arrives in your inbox every morning
- No setup needed — Reports are generated automatically for your account
- Easy to read — Color-coded tables and indicators make it simple to spot issues at a glance
- Actionable insights — Each section includes guidance on what the numbers mean and when to take action
Report Preview
Section titled “Report Preview”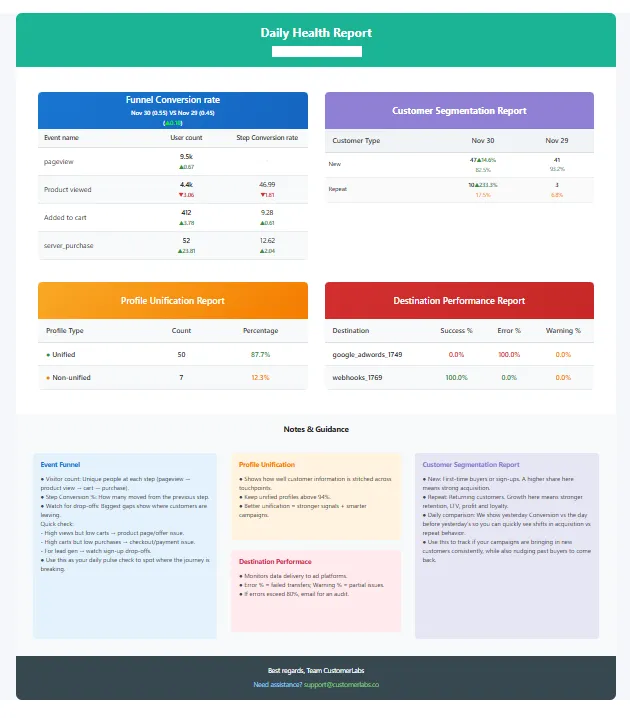
Need Help?
Section titled “Need Help?”If you have questions about your Daily Health Report or want to enable additional features, contact us at [email protected].