Source Logs
Source Logs provide a comprehensive, real-time view of event data ingested into CustomerLabs from all configured sources. These logs allow developers to track processing status, verify incoming payload structures, and troubleshoot connectivity issues between external sources and the CustomerLabs platform.
Accessing Source Logs
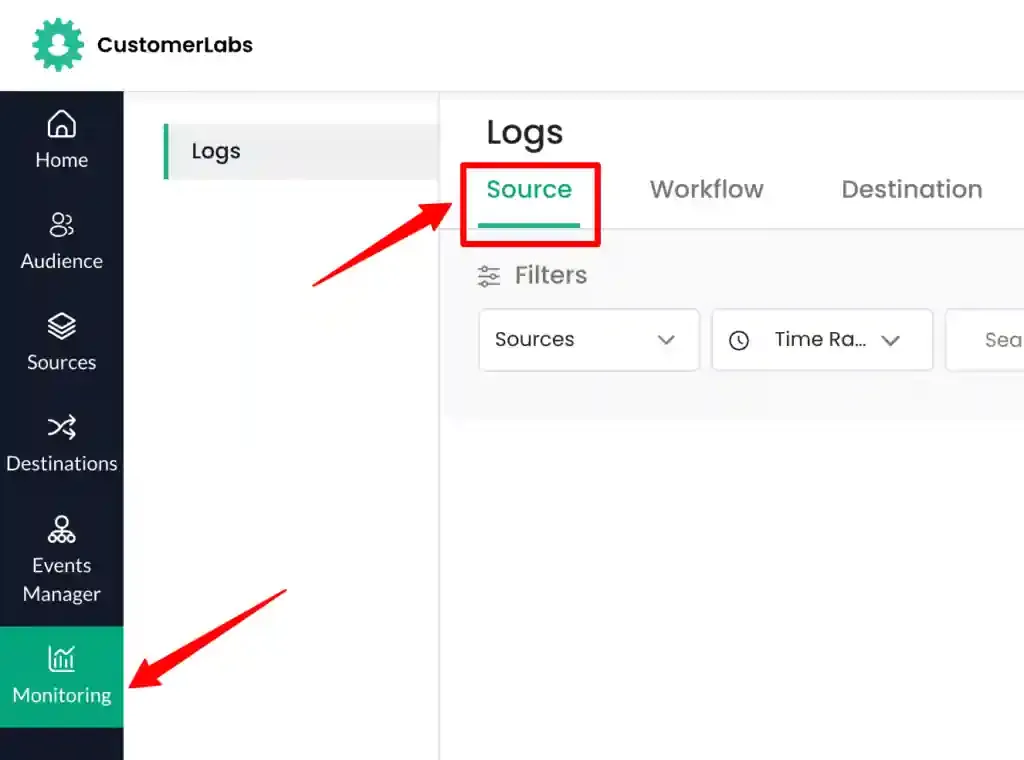
Section titled “Accessing Source Logs”To access the logs dashboard, navigate to Monitoring → Logs → Source.
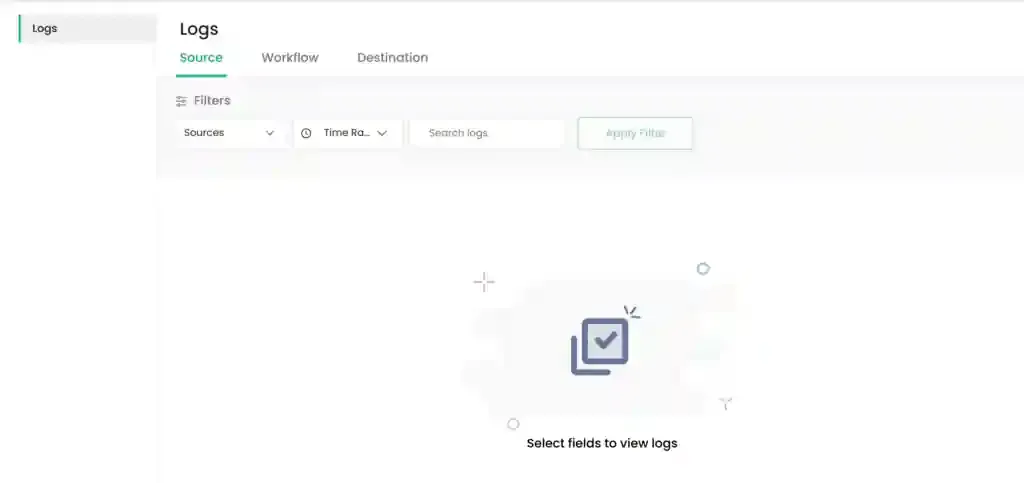
The dashboard initially displays an empty state with filtering controls at the top.
Verifying if events are pushed into the datalayer
Section titled “Verifying if events are pushed into the datalayer”Source logs are automatically generated once an event signature is processed by CustomerLabs. To view specific entries, you must select from the available sources and define a time window.
Verification of Google Tag Manager Installation on your website
Section titled “Verification of Google Tag Manager Installation on your website”For sources like Google Tag Manager (GTM), ensure that the installation on your website is correctly sending events to CustomerLabs. Source Logs will capture all data transmitted via GTM, allowing you to verify that custom events and variables are reaching the platform as expected.
Setting up of CustomerLabs Events in GTM
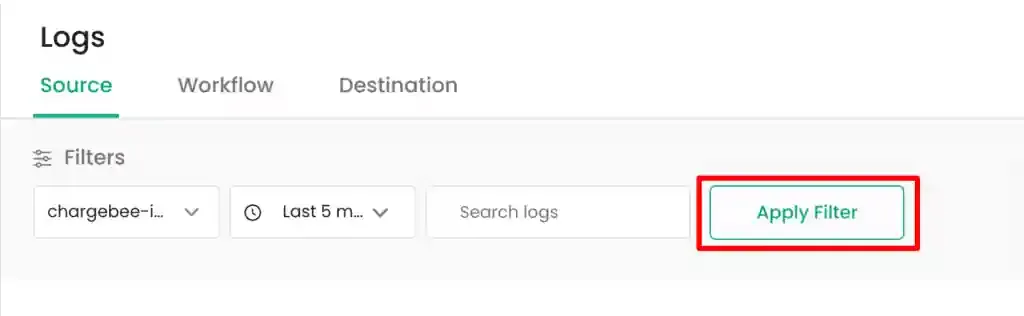
Section titled “Setting up of CustomerLabs Events in GTM”Configure the following filter criteria to populate the Source Logs table.
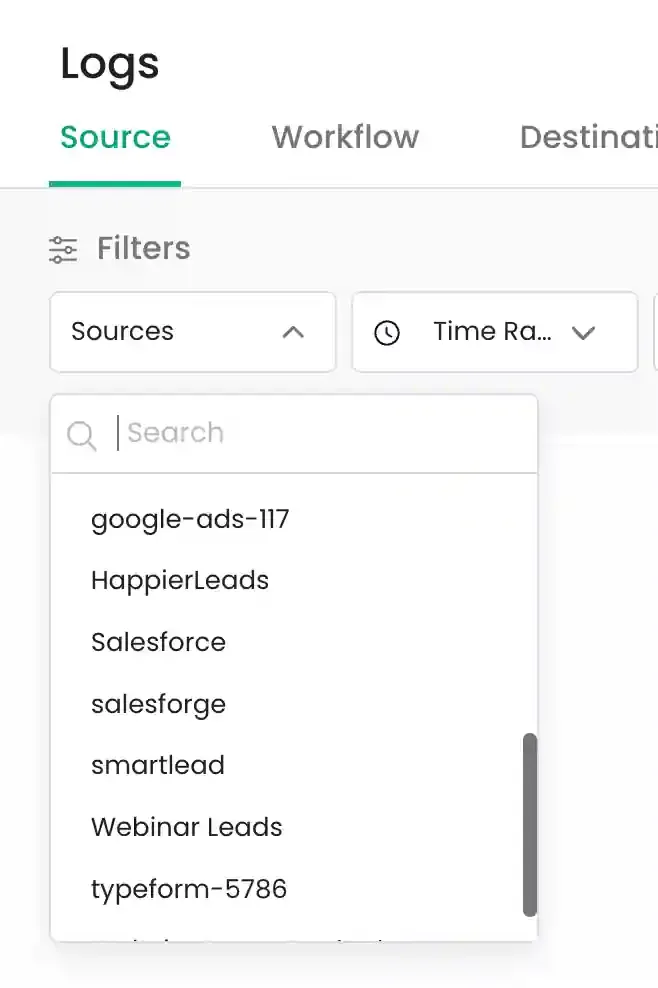
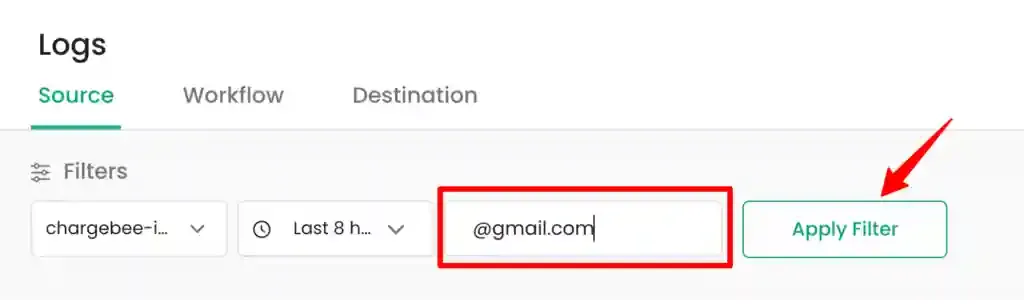
- Sources Filter: Select a specific source from the dropdown menu to see only events from that connection.
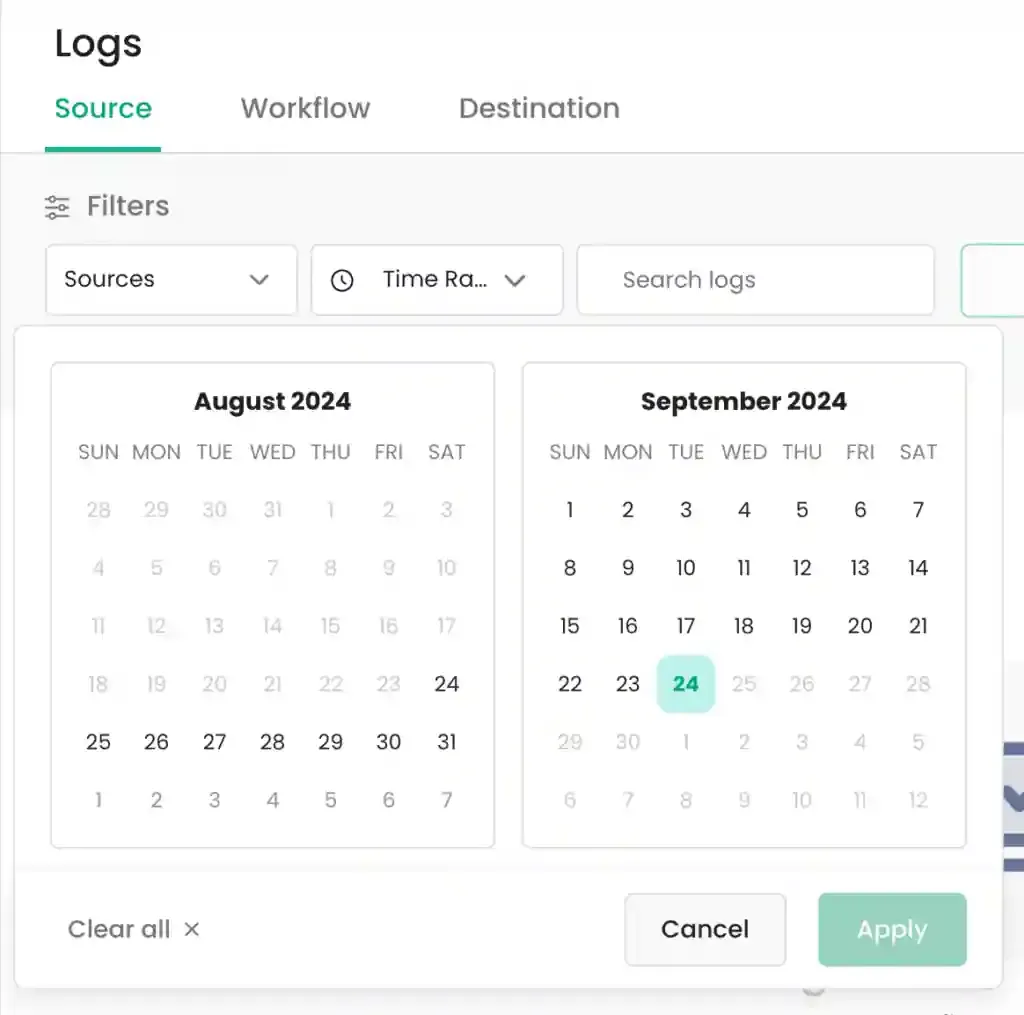
- Time Range Filter: Choose from predefined relative time frames.
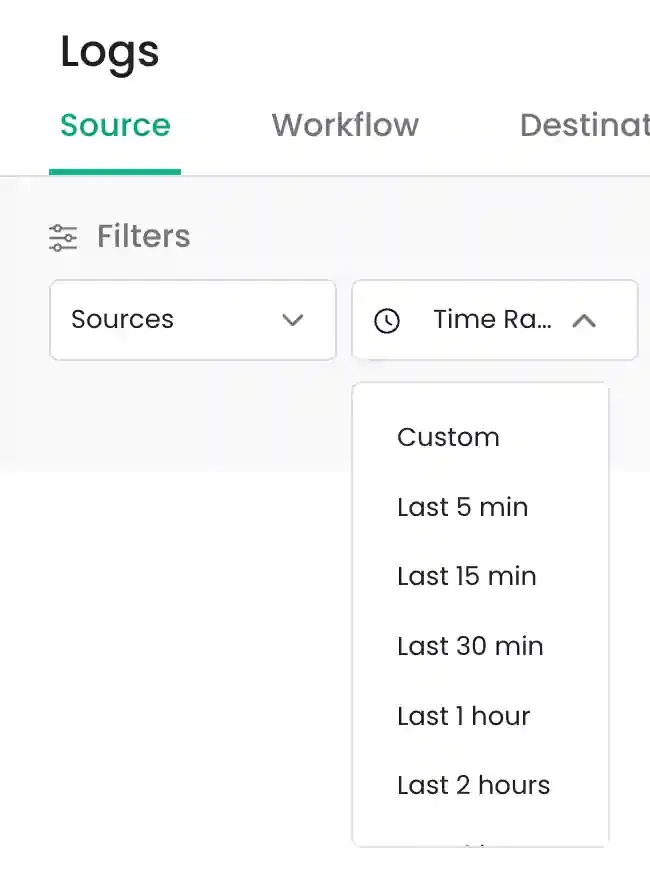
You can also specify a Custom range using the interactive calendar picker.
- Search By Filter: Use the search input to filter for specific strings within the event data, such as a user identity or internal
ID. Note that this search is case-sensitive.
Testing and Validation
Section titled “Testing and Validation”Once filters are configured, you can view and inspect the resulting log entries to validate data integrity.
Viewing Source Log Results
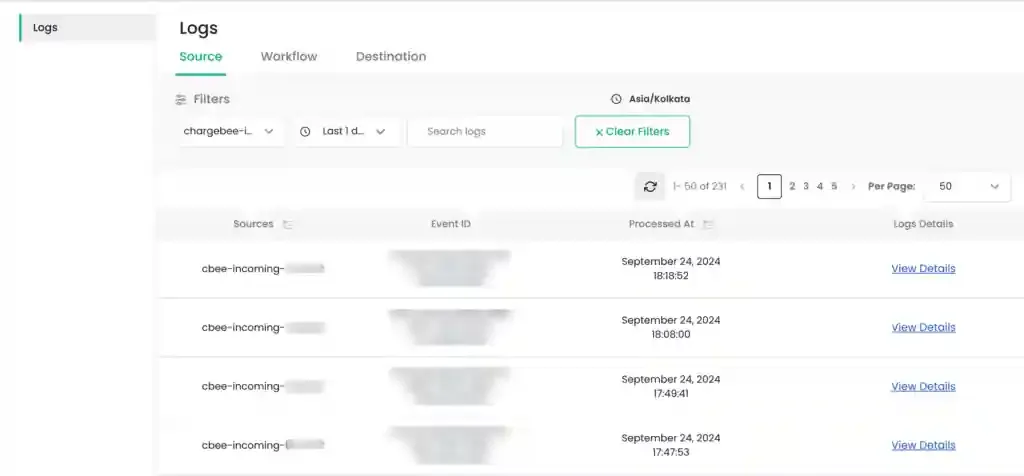
Section titled “Viewing Source Log Results”The logs will populate in a table format showing the source, Event ID, and timestamp.
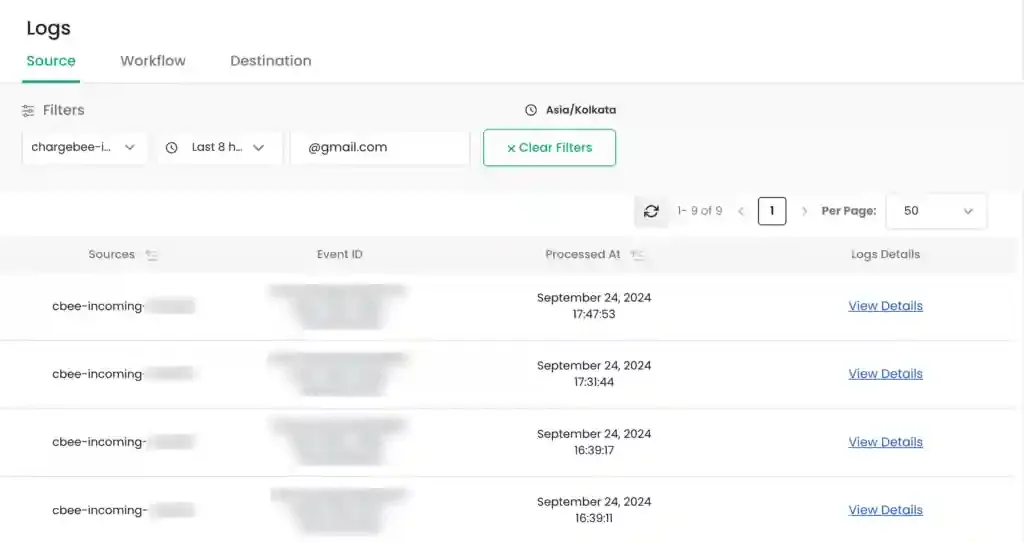
To refine results further or if the table is empty, ensure mandatory fields are selected and click the Apply Filter button.
Locate a specific log entry and click the View Details hyperlink to open the inspection side panel.
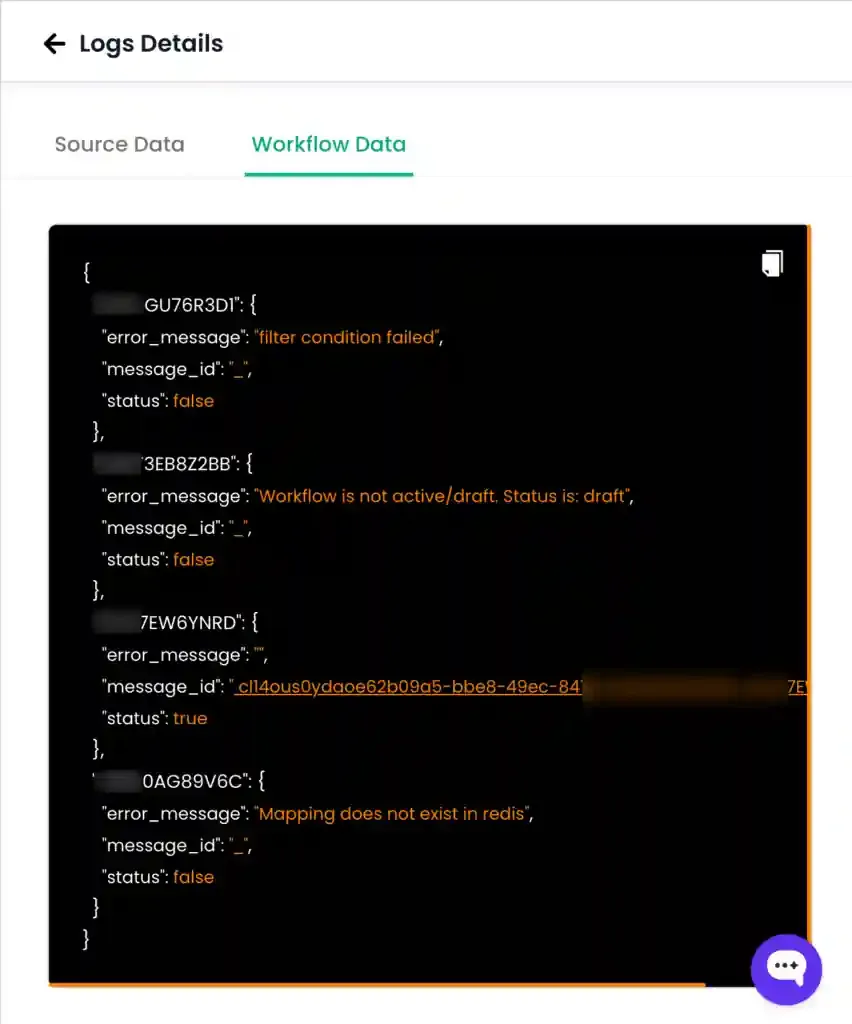
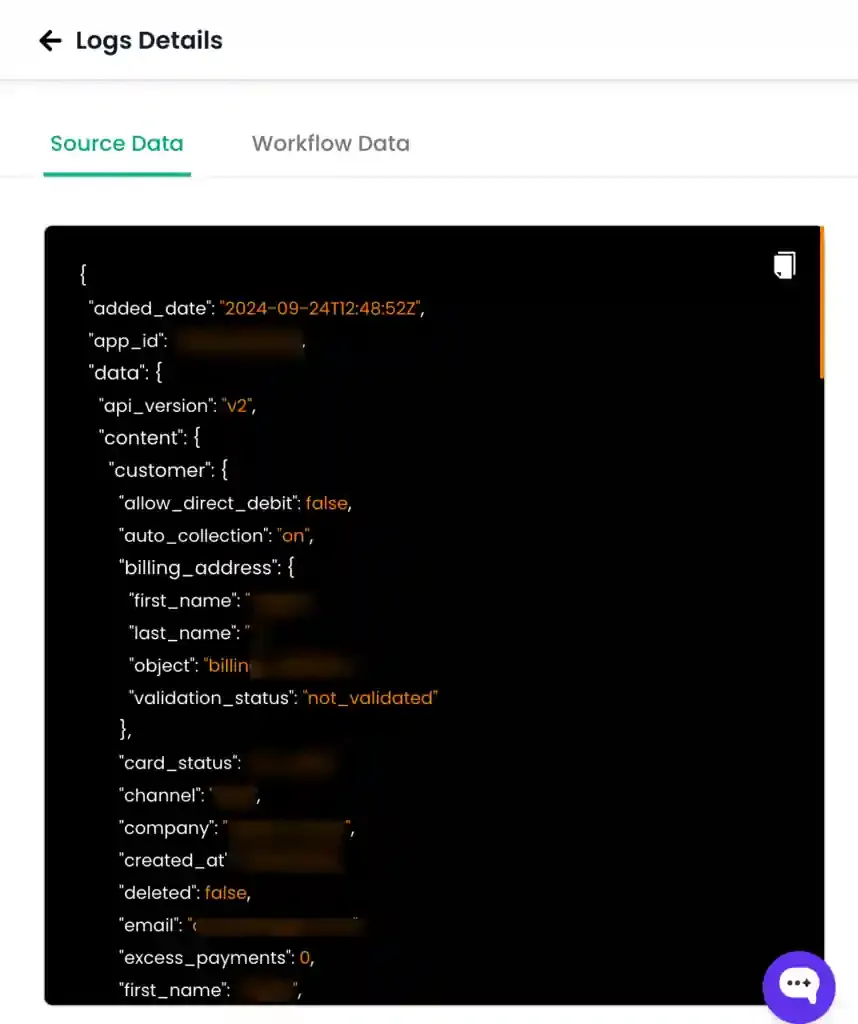
Inspecting JSON Payloads
Section titled “Inspecting JSON Payloads”The inspection panel displays the raw data associated with the event.
The Source Data tab displays the raw payload as it was received from the incoming source.
Maintenance and Troubleshooting
Section titled “Maintenance and Troubleshooting”Use the following tools to manage your log views.
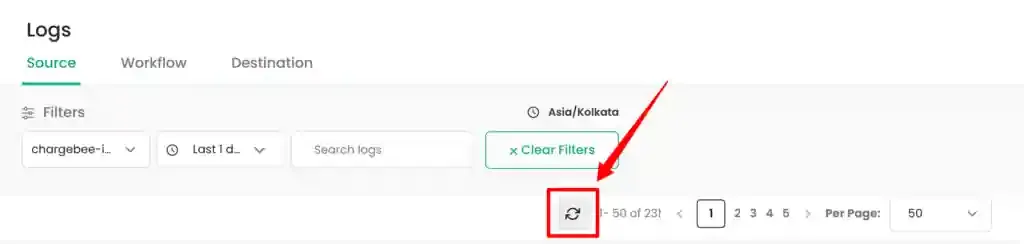
-
Clear Filters: Click the
Clear Filtersbutton to reset all current filter selections to their default state.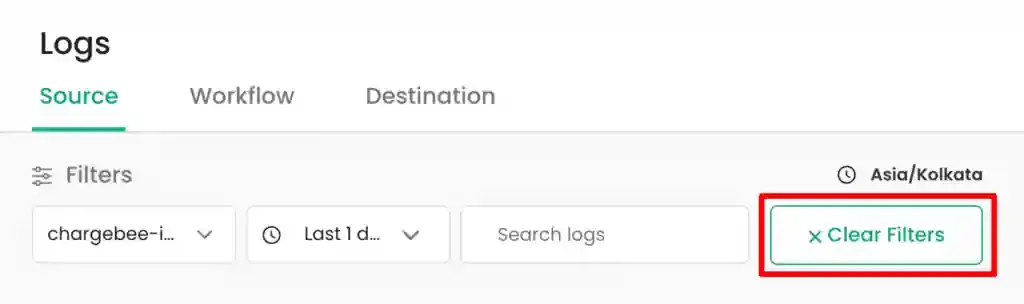
-
Refresh Logs: Click the refresh icon to fetch the latest entries based on your existing filter settings.
Download
Section titled “Download”Maintaining and verifying incoming data is critical for accurate downstream workflows. While logs are historical, real-time verification ensures that your integration is robust.
Quick Example: Verifying CRM Ingestion
Section titled “Quick Example: Verifying CRM Ingestion”To verify if a specific trait was successfully ingested from a CRM source in the last day:
-
Select the relevant
CRMsource from the dropdown.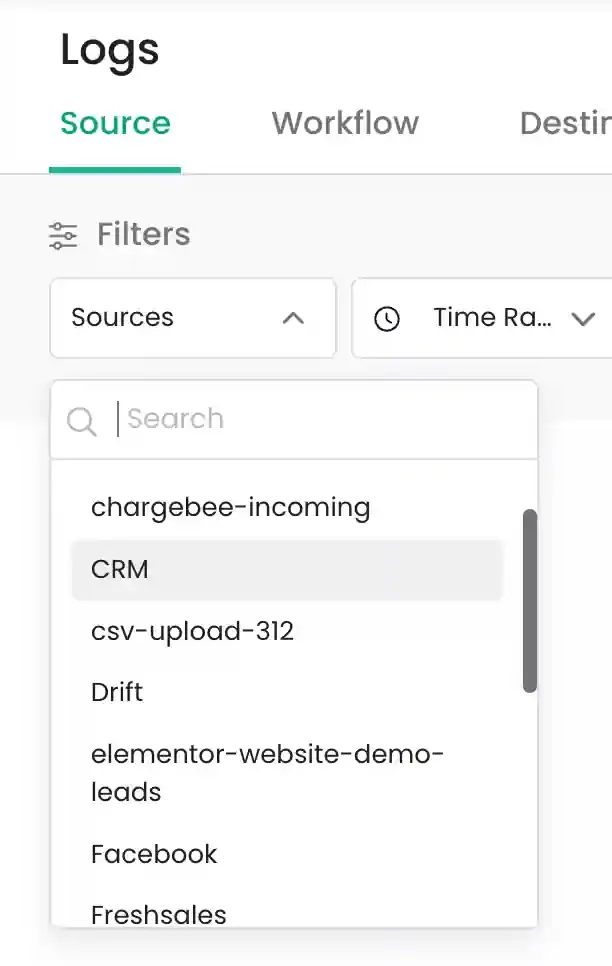
-
Set the
Time rangetoLast 1 day.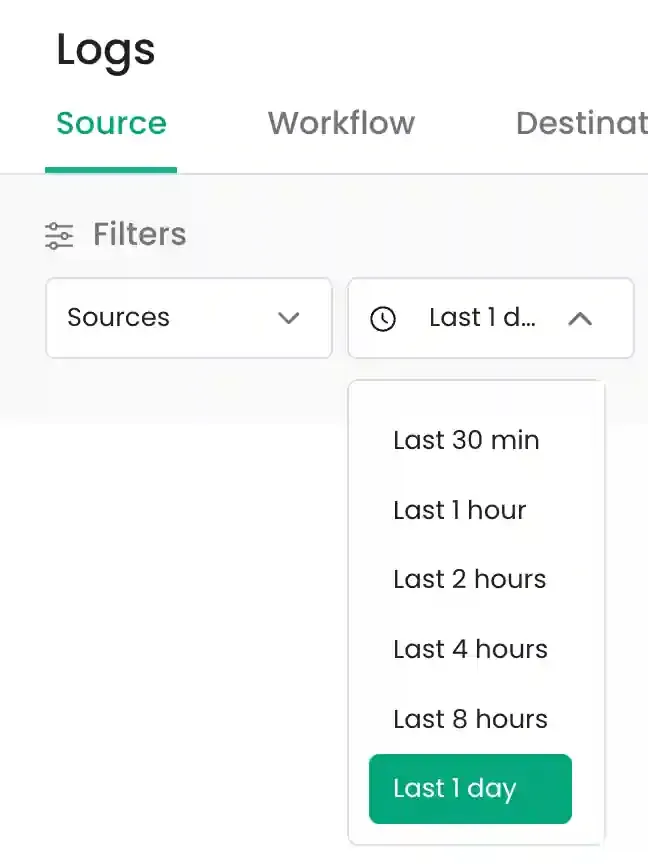
-
Click
Apply Filterto refresh the results table for the selected CRM source.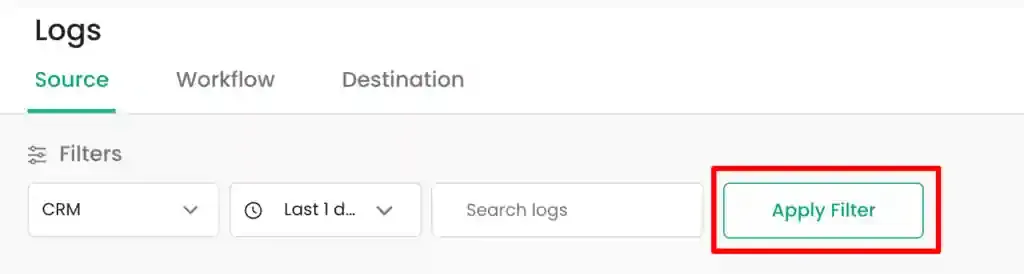
-
Navigate to the log entry in the results and click
View Details.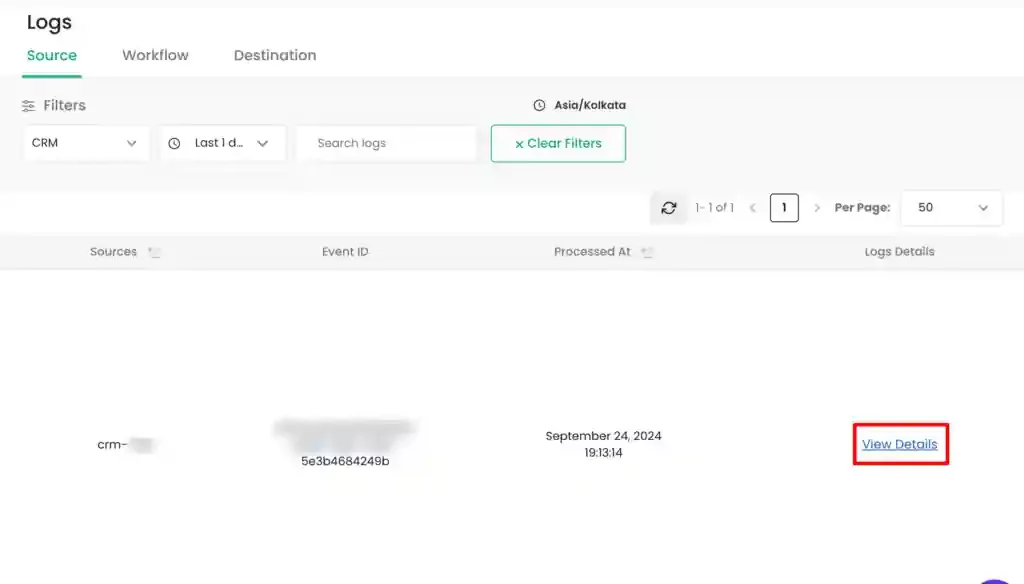
-
Verify the incoming attributes in the
Source Dataview.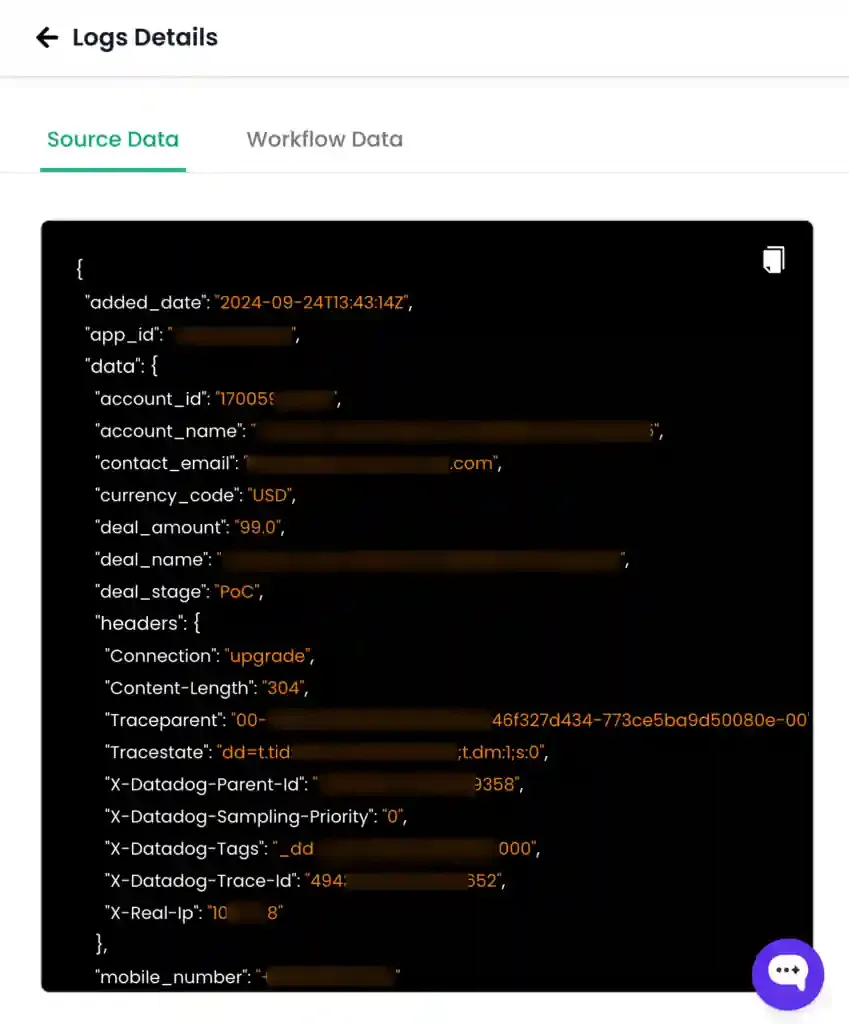
-
Switch to the
Workflow Datatab to review the processing path and internal status of the event.