Workflow Logs — Trace and Troubleshoot Workflow Event Processing
The Workflow Logs provide a comprehensive overview of events configured within workflows, including the source data and their associated processing paths. This dashboard allows you to efficiently track workflows and their transformed events using various filters, enabling informed decision-making and effective troubleshooting.
Accessing Logs
Section titled “Accessing Logs”To access the workflow logs, navigate to the following path in the CustomerLabs dashboard:
Monitoring → Logs → Workflow
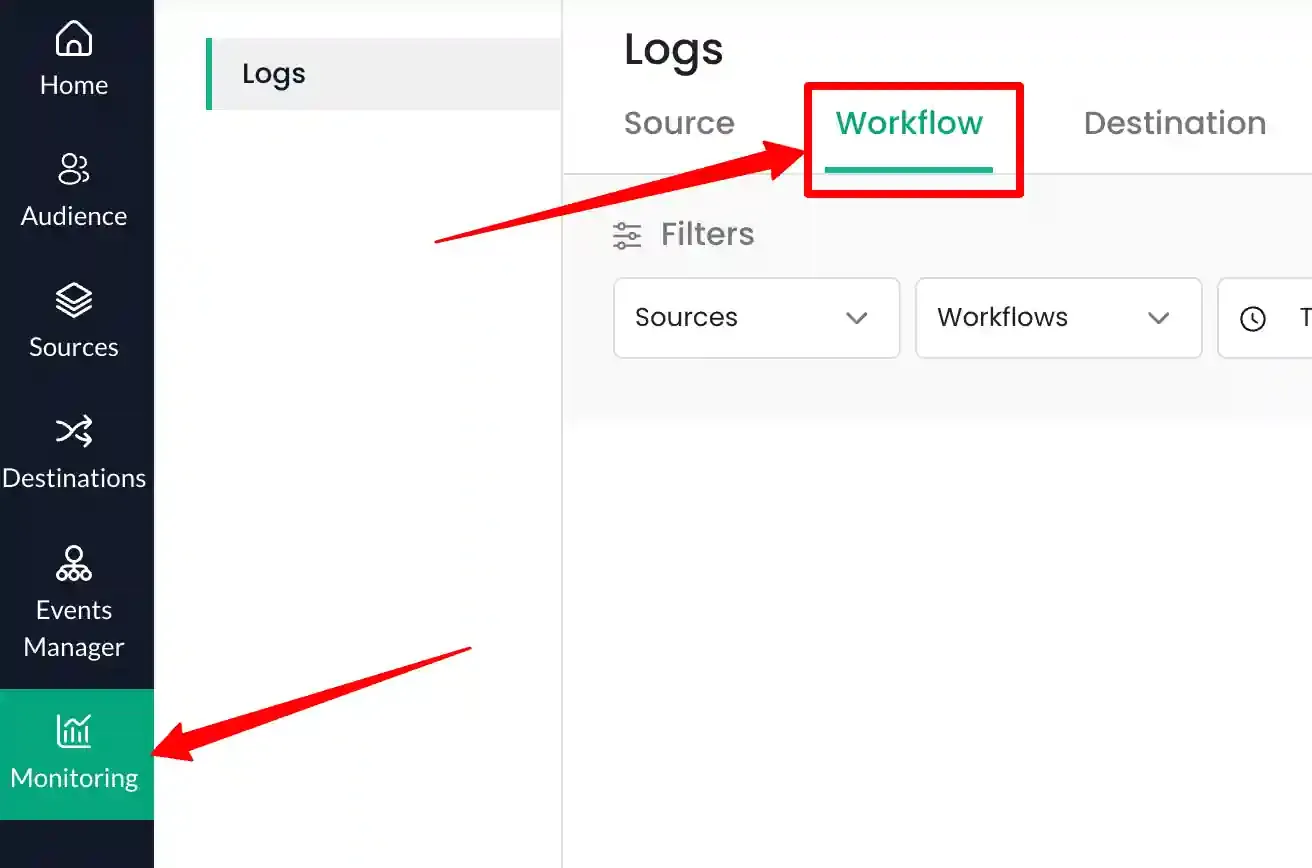
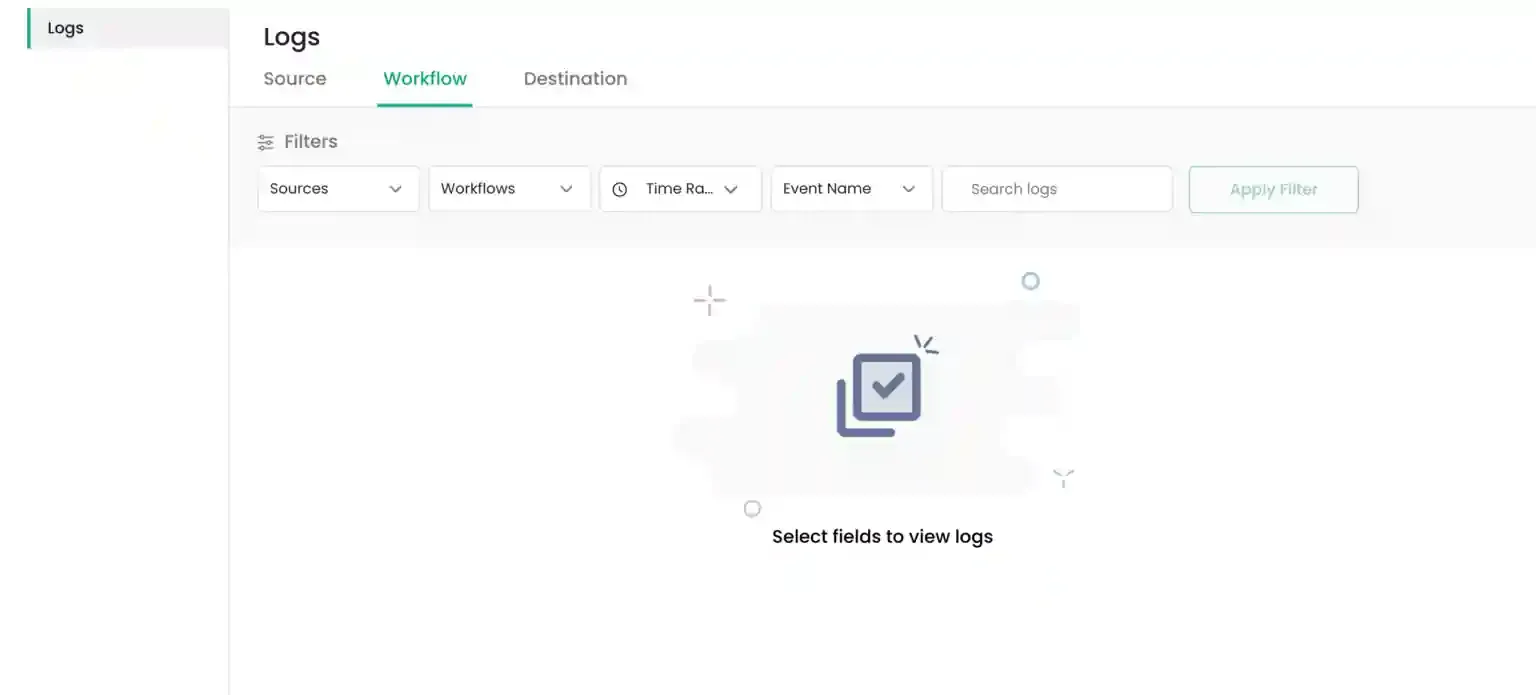
The dashboard will display the log filtering interface. Ensure that you have configured at least one workflow source to begin viewing data.
Verifying if events are pushed into the datalayer
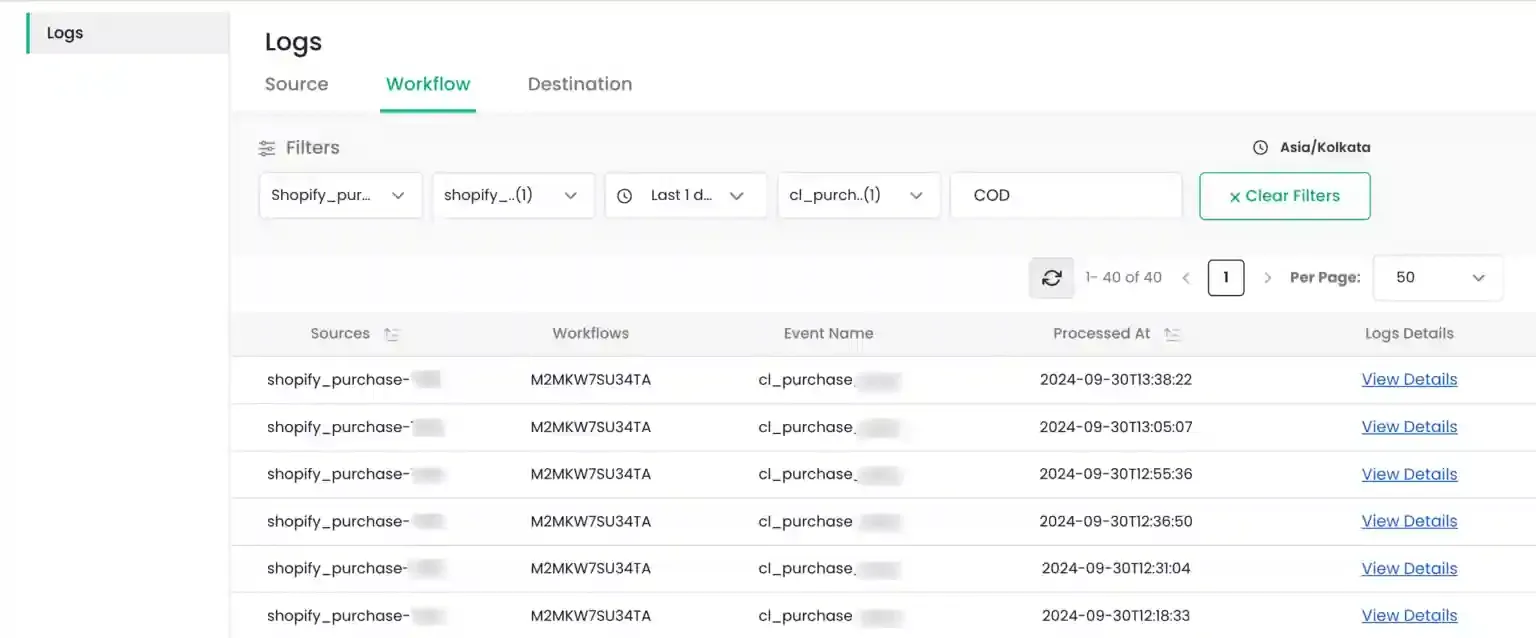
Section titled “Verifying if events are pushed into the datalayer”Workflow logs are generated for workflows configured across each source. Each log entry represents a transformed event that has been processed from the incoming source data.
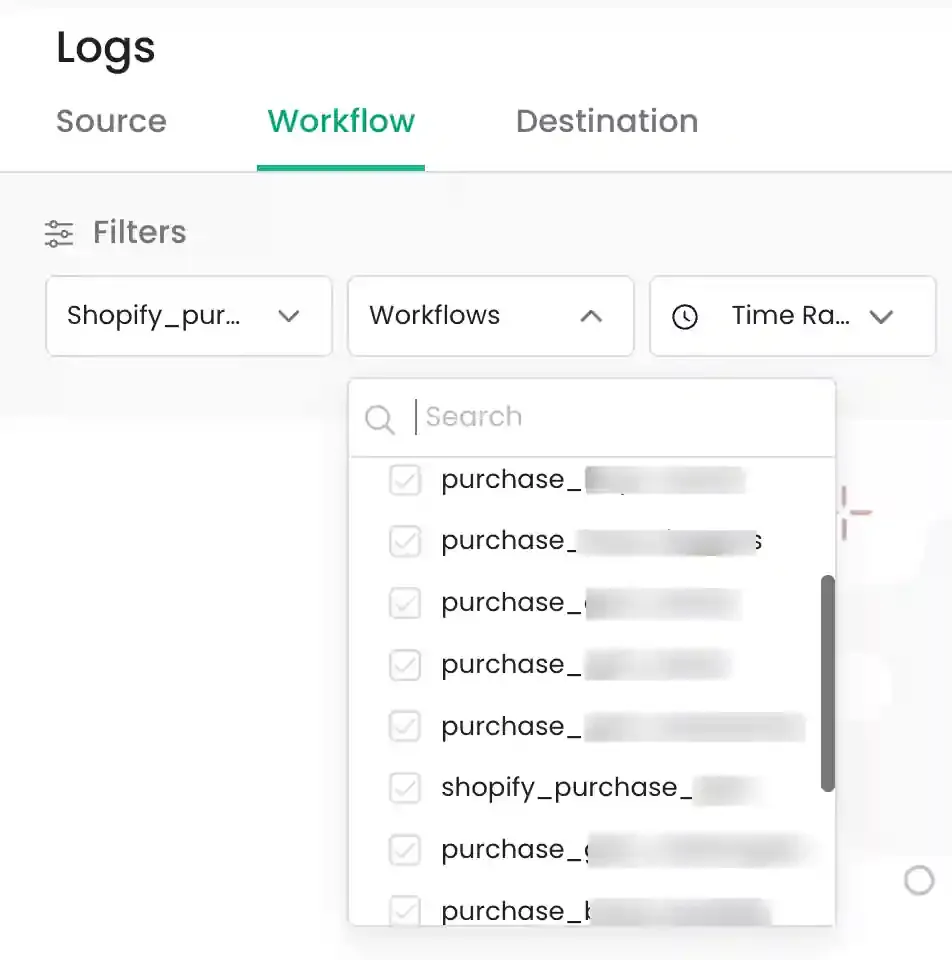
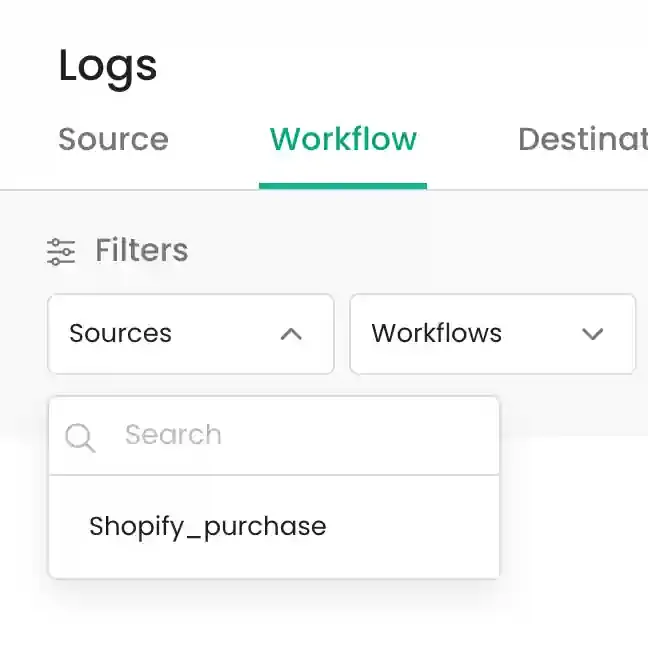
- Source Filter: In the Source dropdown, all connected sources will be listed. Select the specific source for which the workflow has been configured.
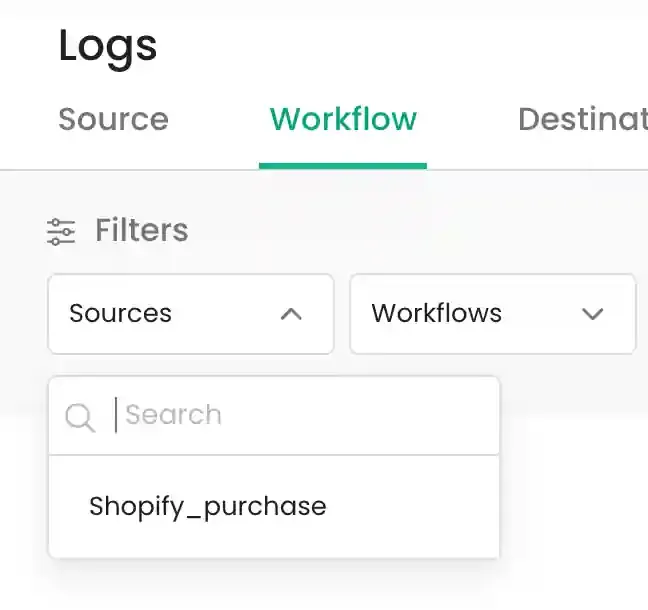
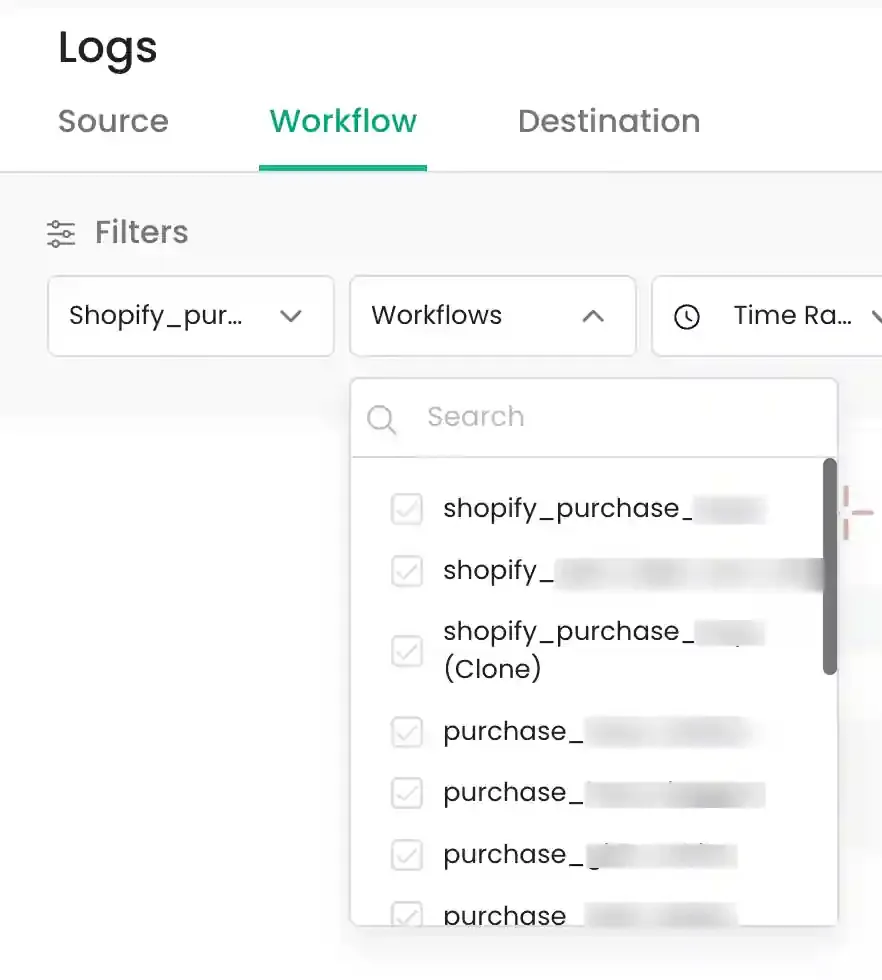
- Workflow Filter: In the Workflow dropdown, workflows configured for the selected source will be displayed. Choose the workflow for which you want to view logs.
Verification of Google Tag Manager Installation on your website
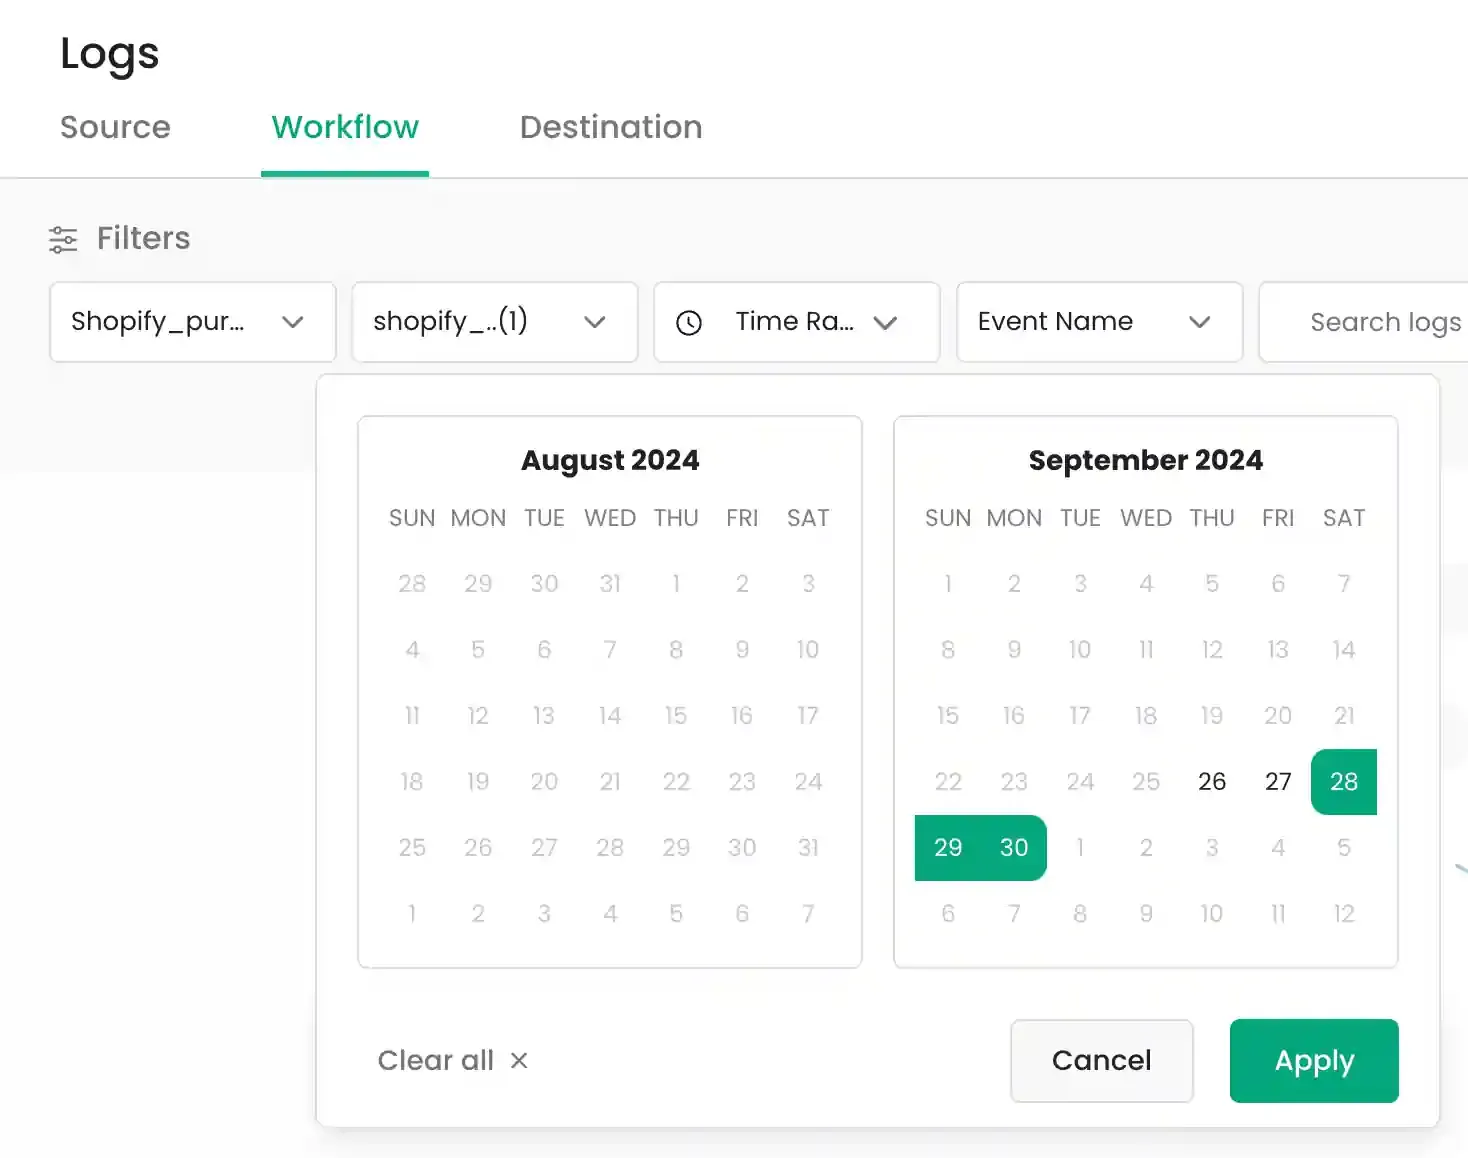
Section titled “Verification of Google Tag Manager Installation on your website”To view logs for a specific time period, use the Time Range Filter. This is critical for verifying real-time events sent via Google Tag Manager or other integrations.
- You can select predefined relative timeframes (e.g., last 5 minutes, last 4 hours, last 1 day).
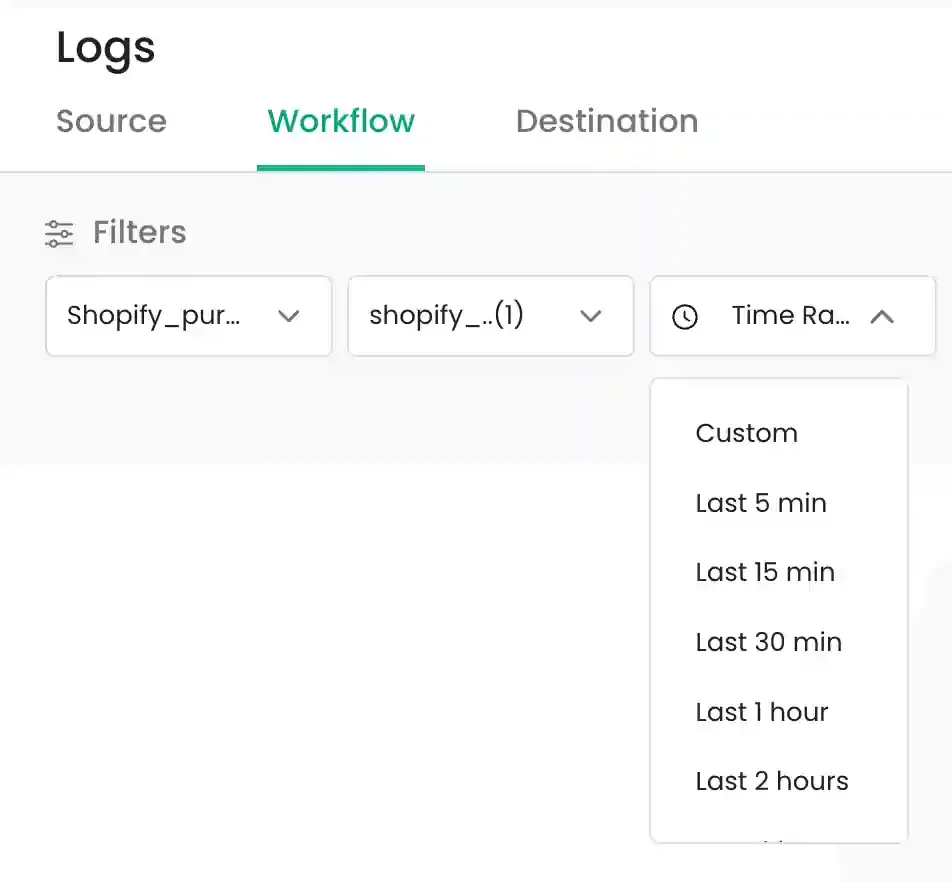
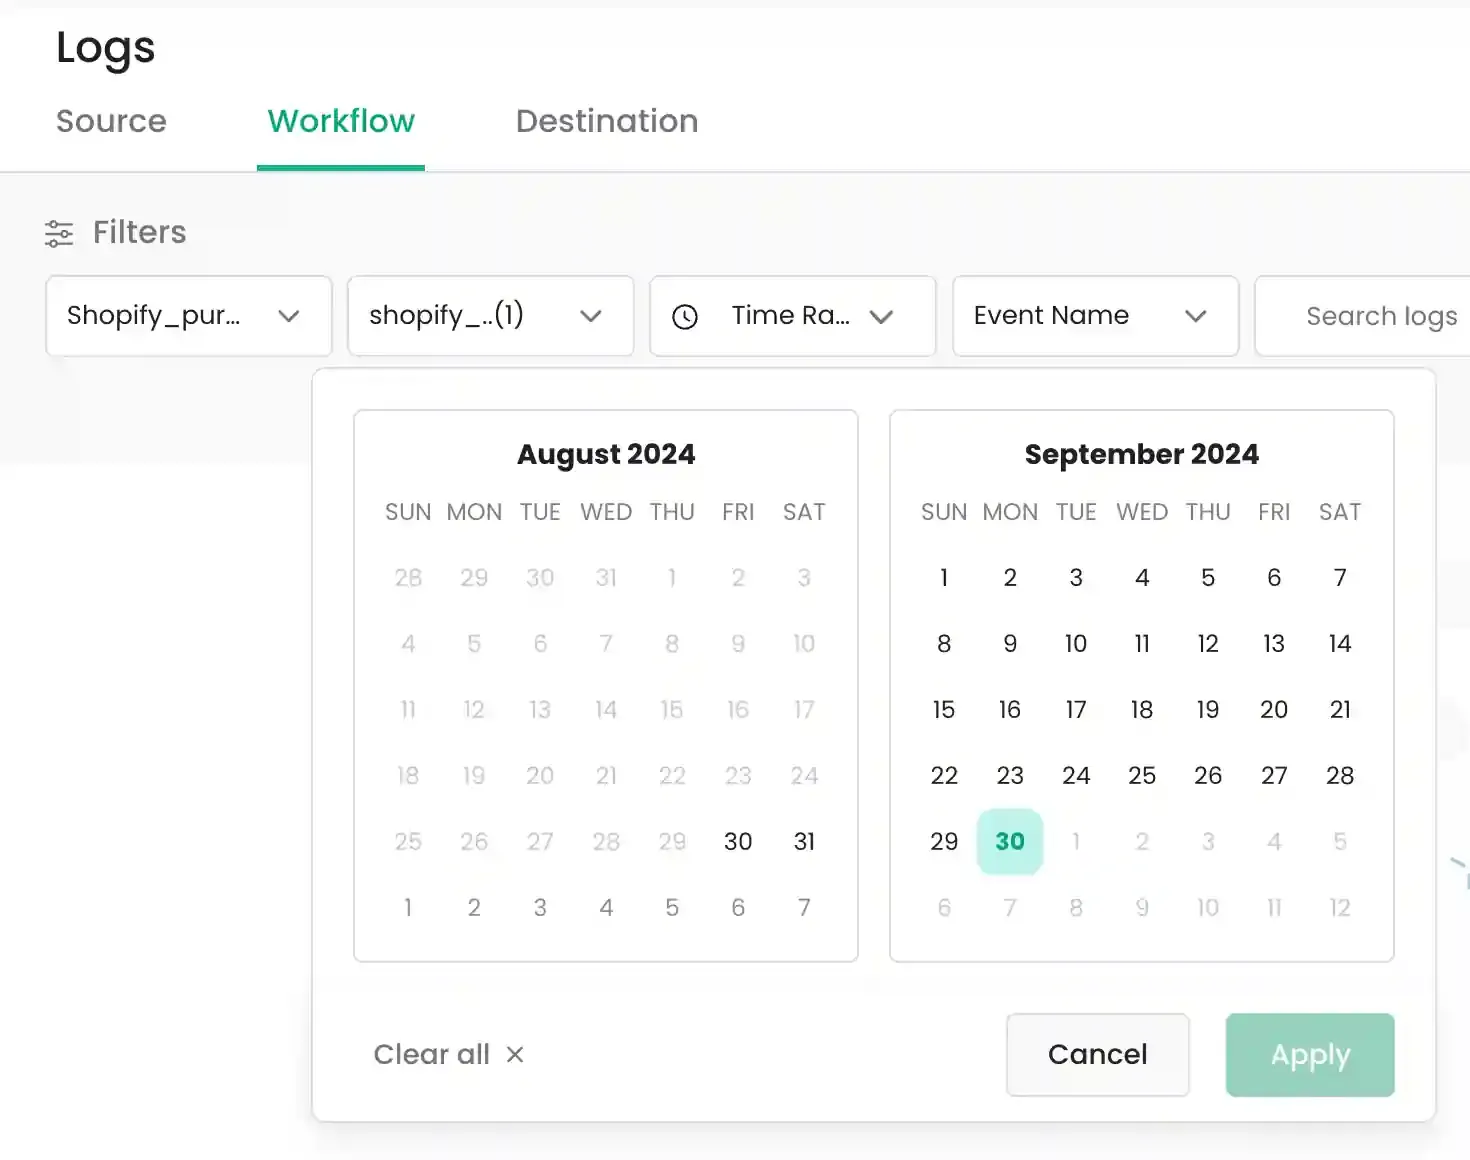
- You can also choose a custom date and time range for precise troubleshooting.
Setting up of CustomerLabs Events in GTM
Section titled “Setting up of CustomerLabs Events in GTM”Use the advanced filtering options to locate specific event signatures and payloads.
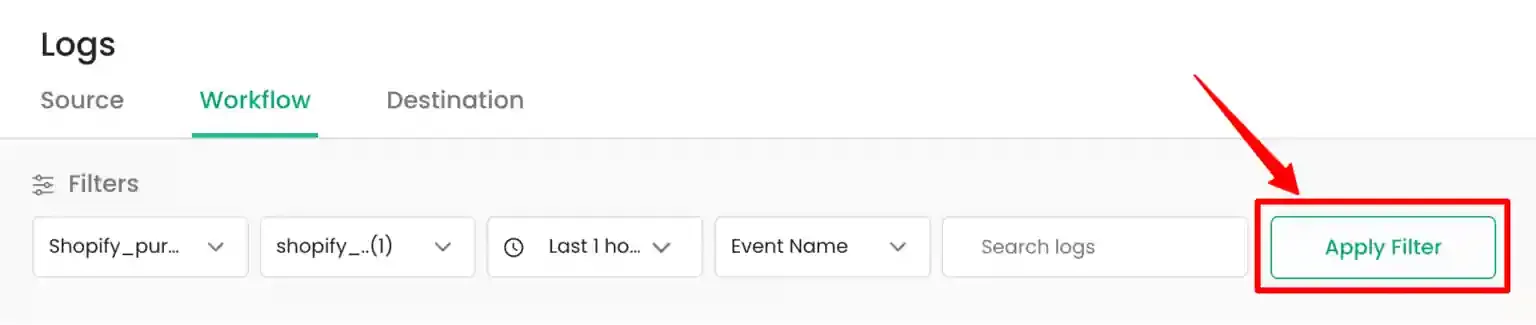
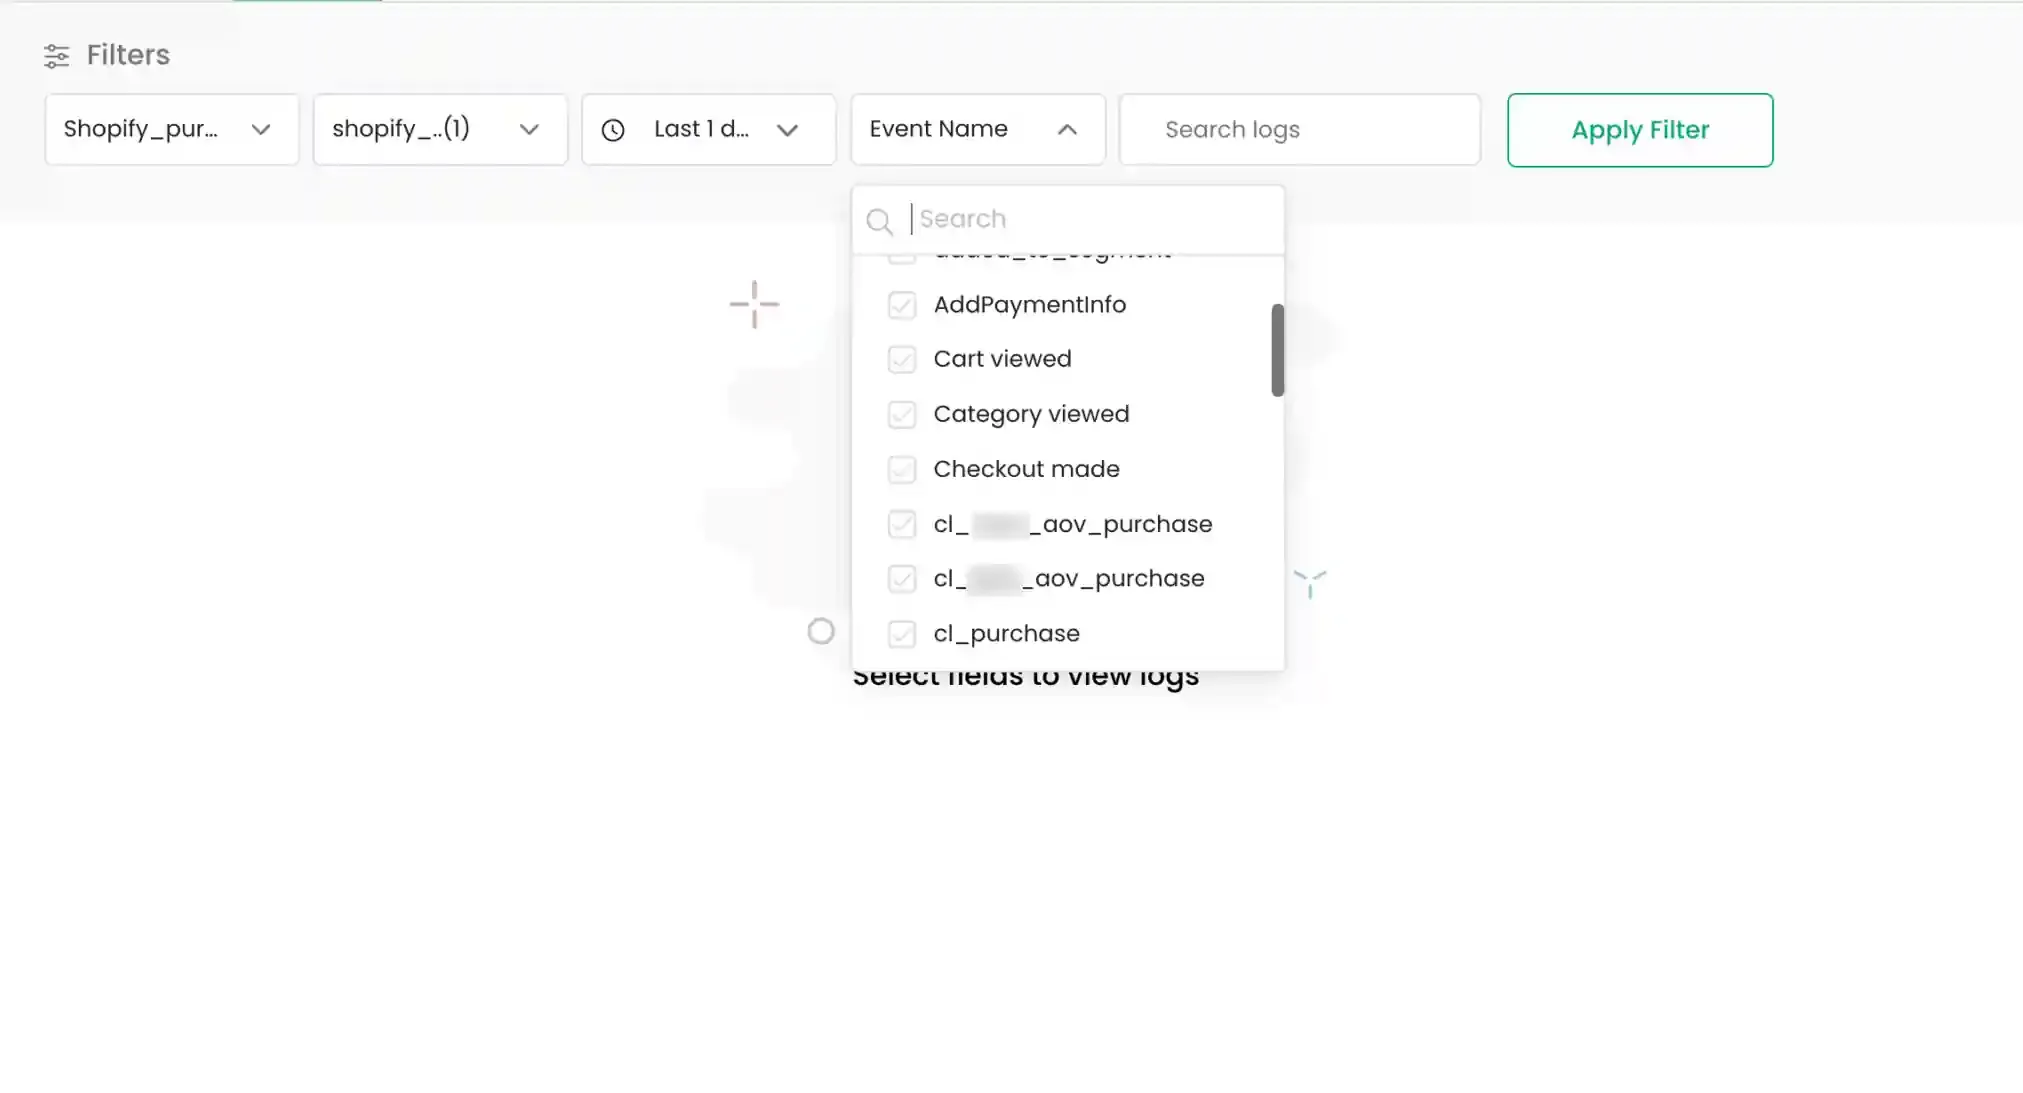
- Event Name Filter: The Event Name field allows you to filter logs based on transformed events. Select the required event name from the dropdown.
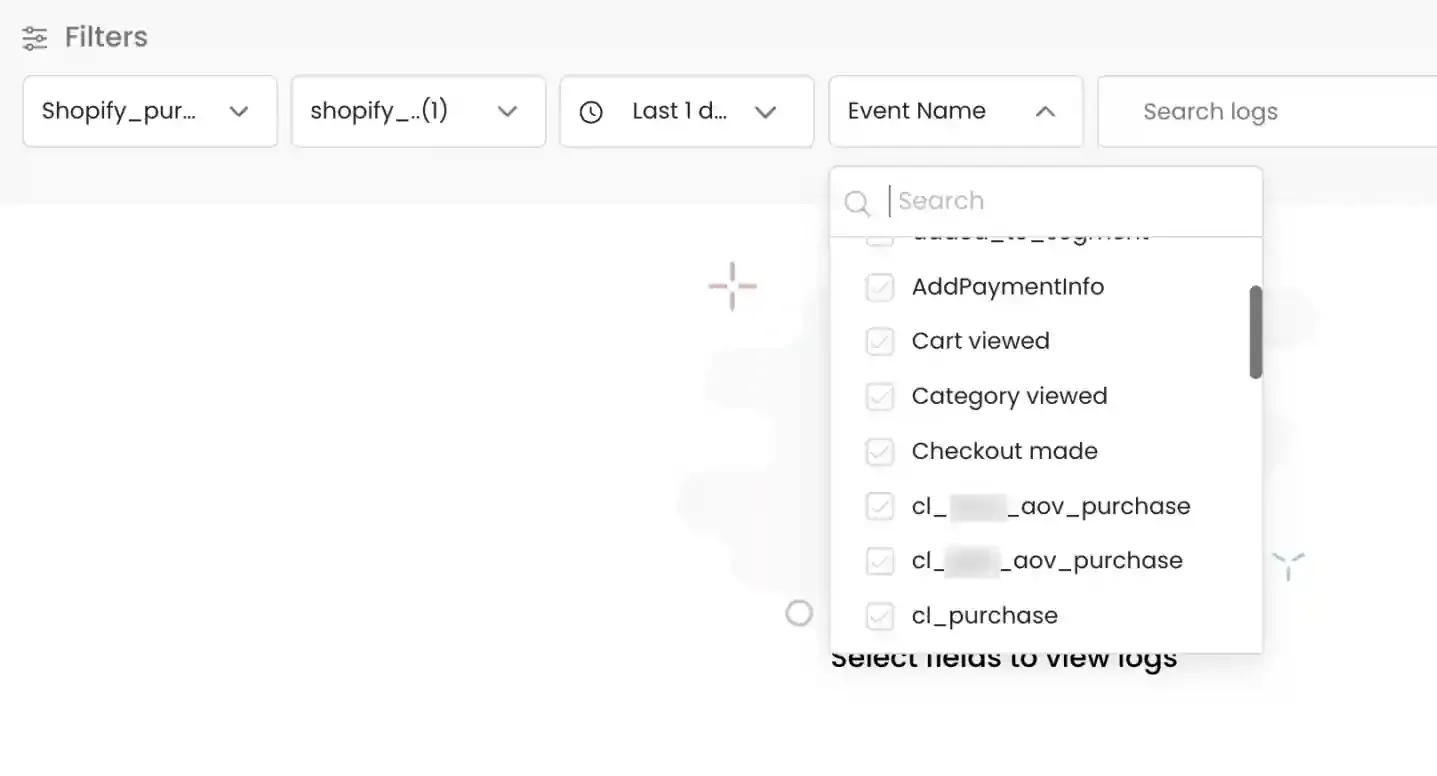
- Search By Filter: The Search By field enables you to filter logs using specific data values. Enter the required text in the
Search Logsfield.
Testing and Validation
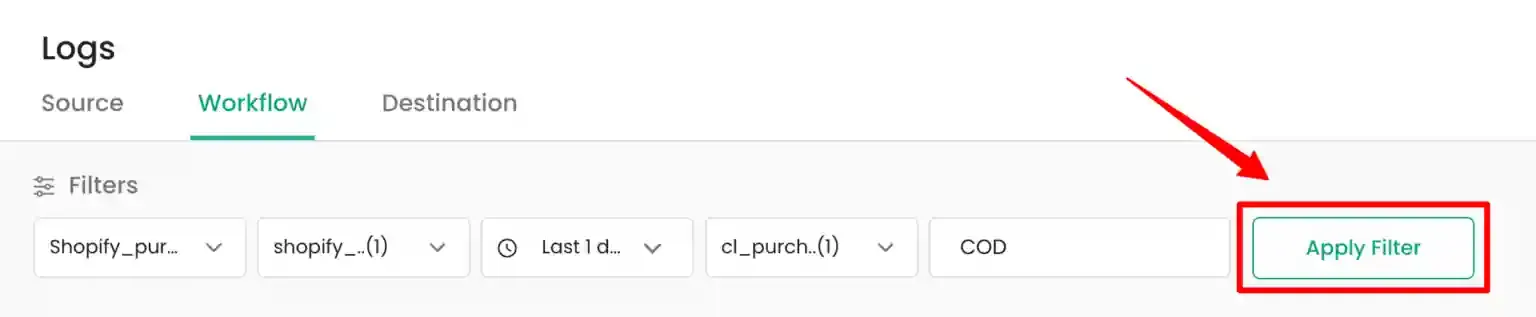
Section titled “Testing and Validation”After selecting the required filters, click the Apply Filter button to view the logs. Ensure that all mandatory fields (Source, Workflow, and Time Range) are selected to enable the button.
Log Details and Inspection
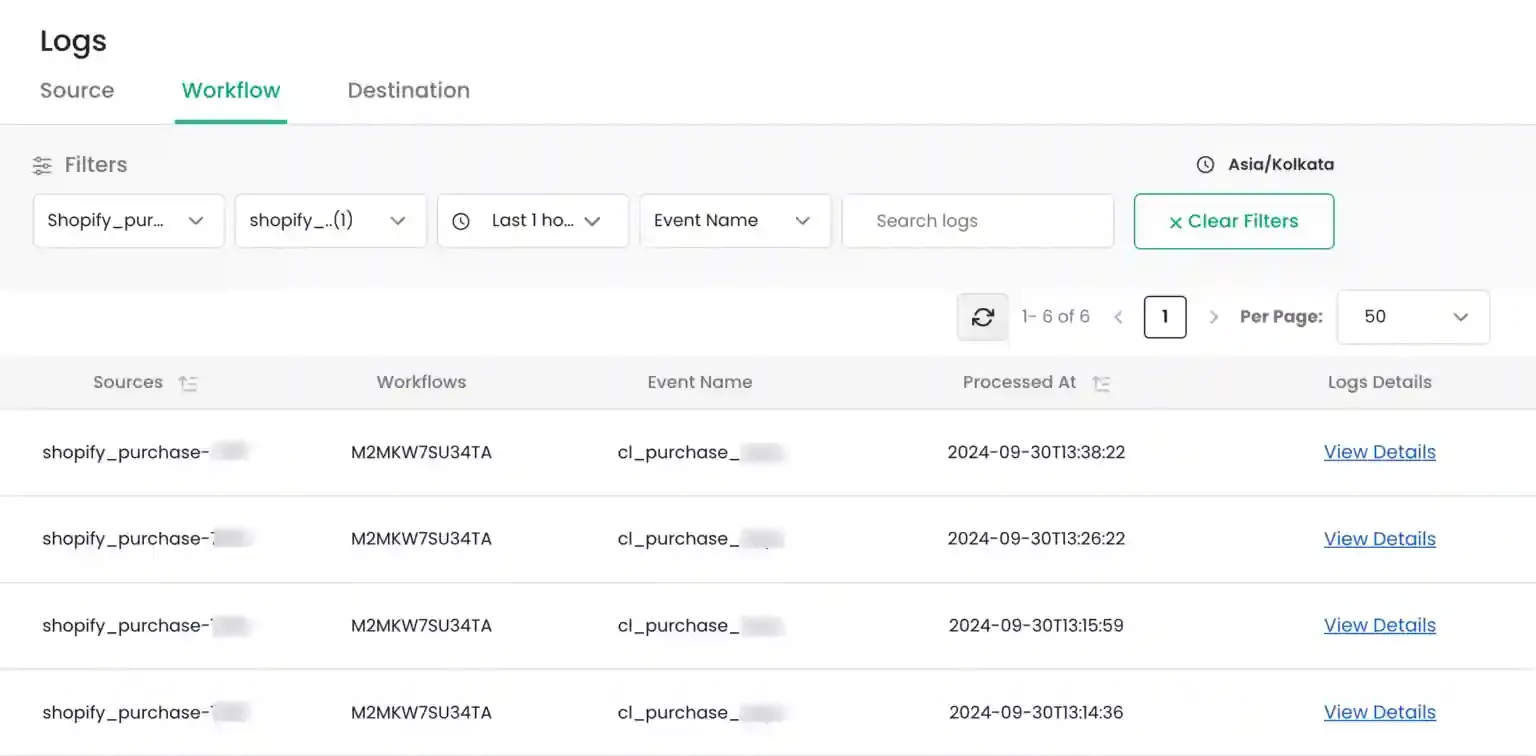
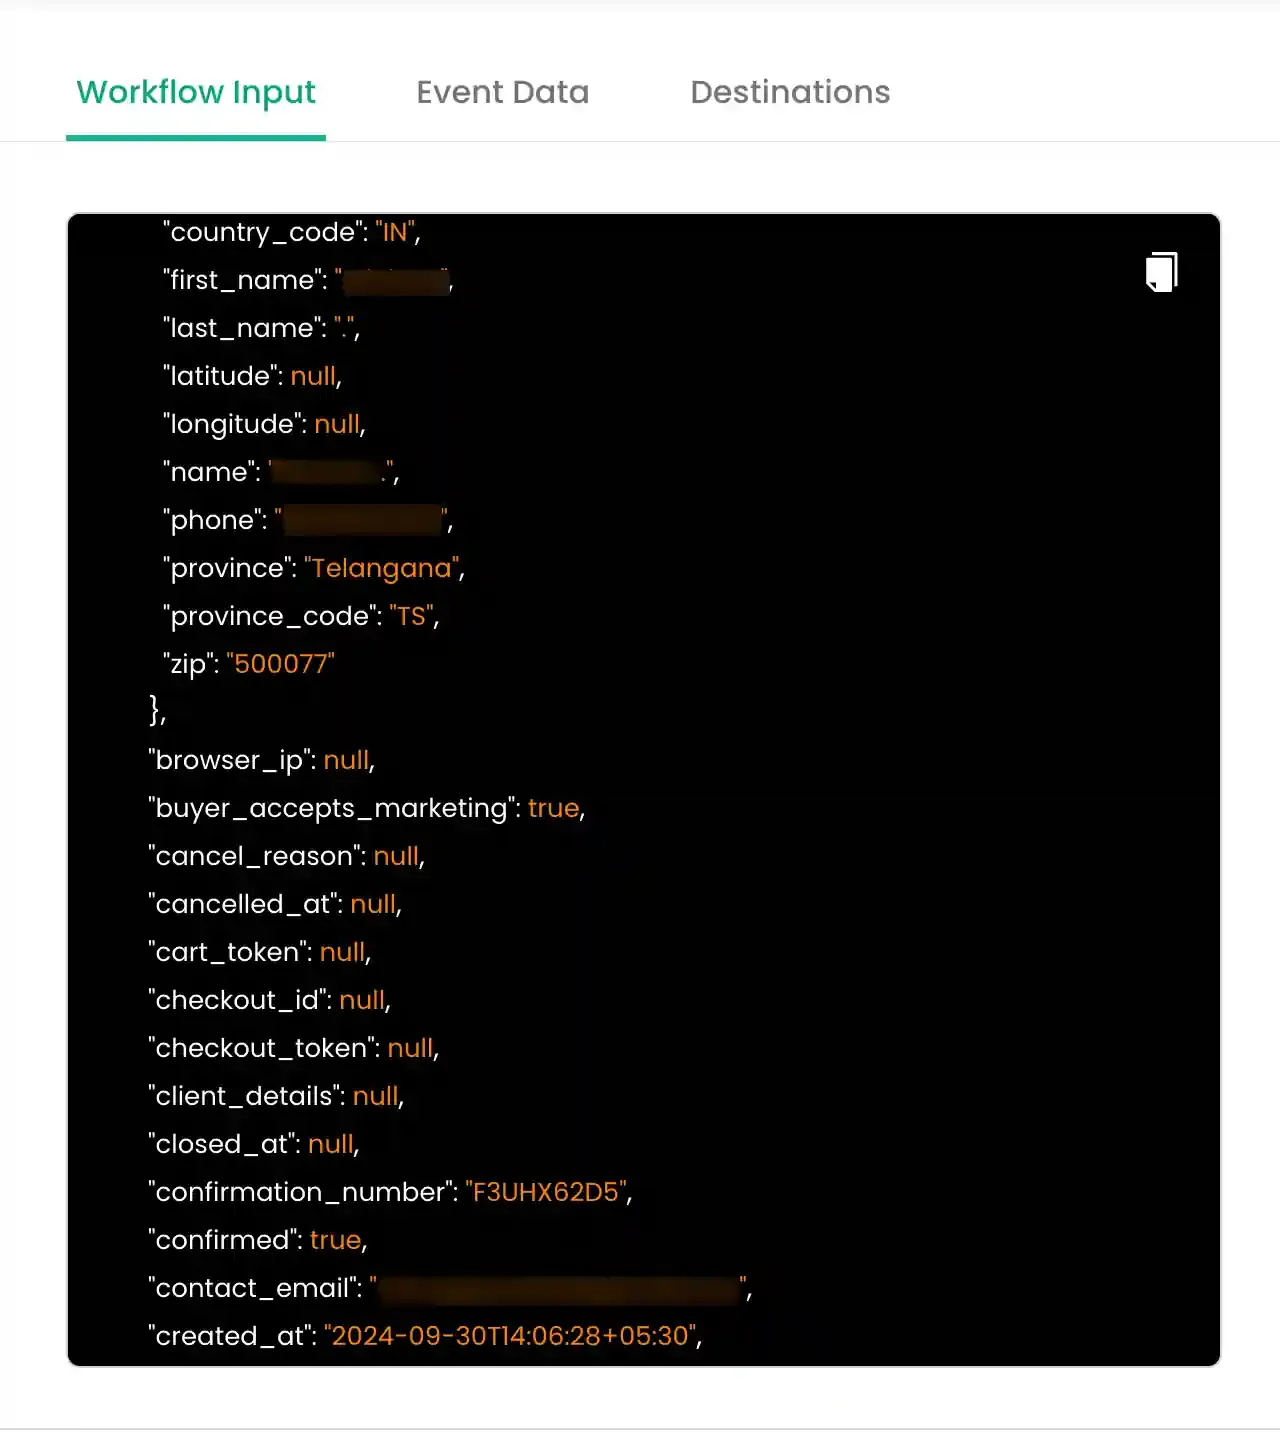
Section titled “Log Details and Inspection”To view detailed information for a specific log, click the View Details hyperlink. This opens a side panel displaying the JSON payload.
The side panel contains three tabs for deep inspection:
Displays the source data as it was received from the selected source (incoming raw data).
Shows the configured event data, including mapped user identifiers, event properties, and product details.
Provides the message ID to access the corresponding logs in the destination dashboard.
Maintenance Tools
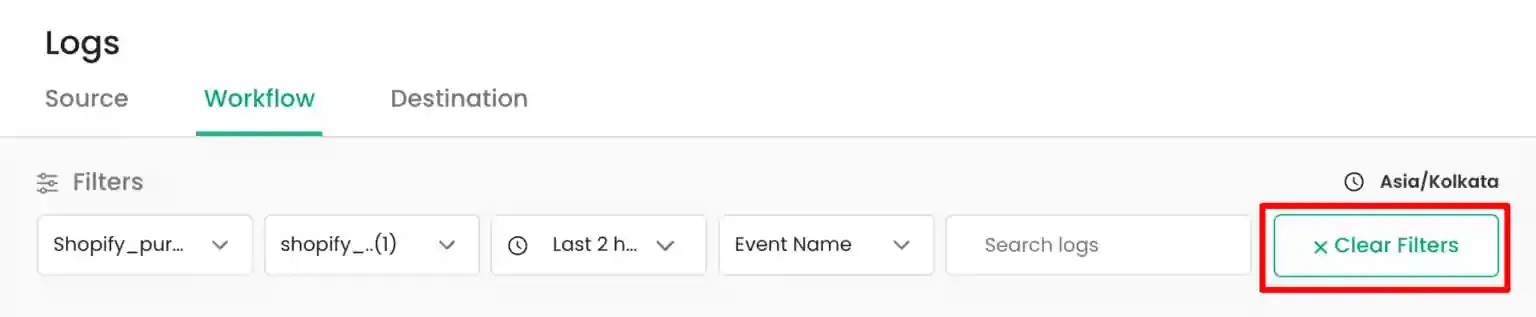
Section titled “Maintenance Tools”- Clear Filters: Restore all filters to their default state by clicking the
Clear Filtersicon.
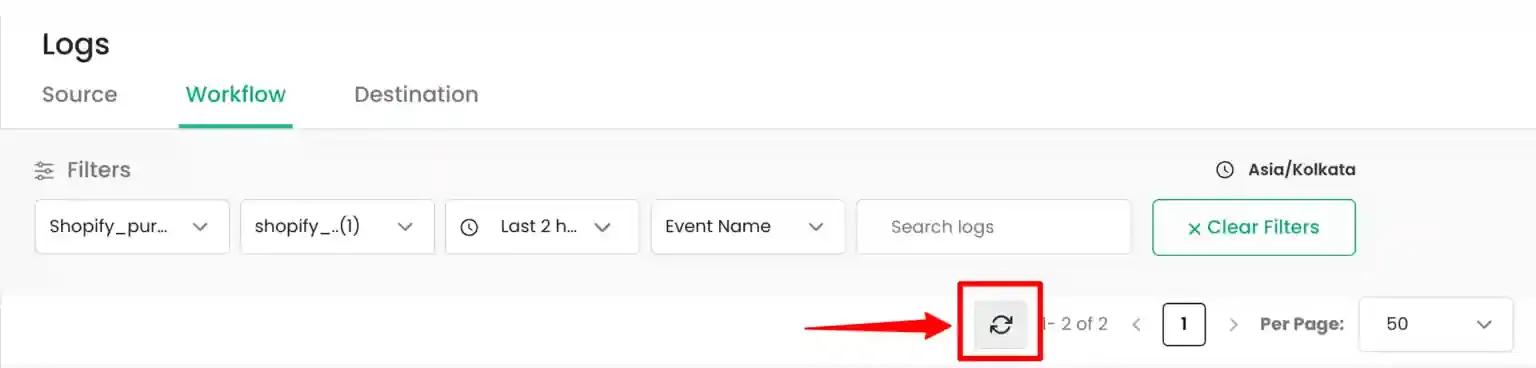
- Refresh Logs: Load the most recent data based on your current filter settings by clicking the
Refreshbutton.
Download
Section titled “Download”Maintaining logs is essential for robust event tracking. Follow this example to validate specific event data.
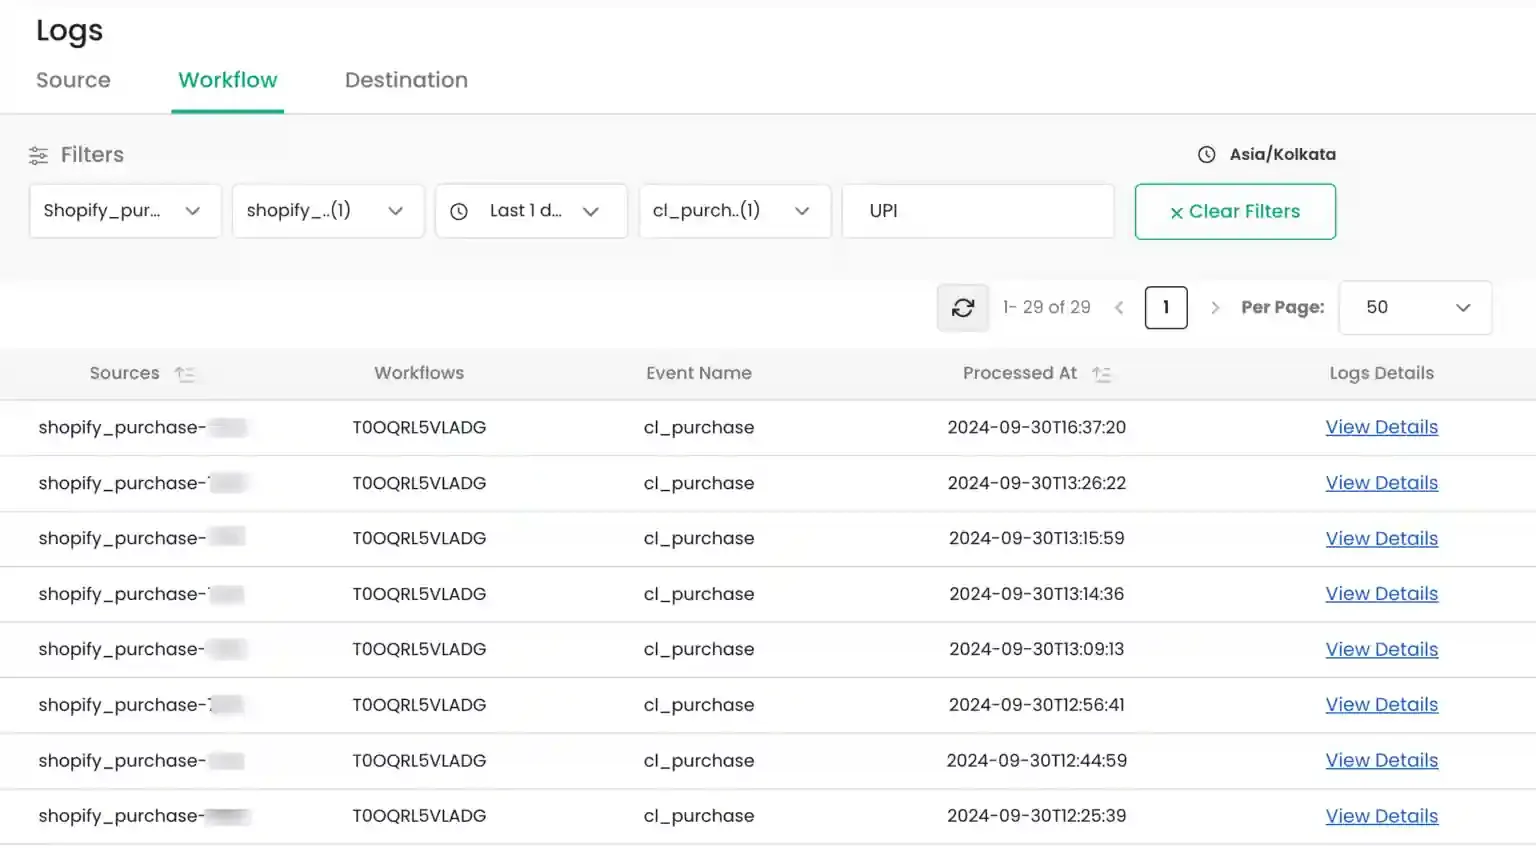
Quick Example: Verifying “cl_purchase” payment method
Section titled “Quick Example: Verifying “cl_purchase” payment method”Use this workflow to check for events where purchases were made using UPI in the last 3 days.
- Select the source from the Sources dropdown.
- Select the workflow from the Workflows dropdown.
- Select the time range as Last 3 days.
- Select
cl_purchasefrom the Event Name dropdown.
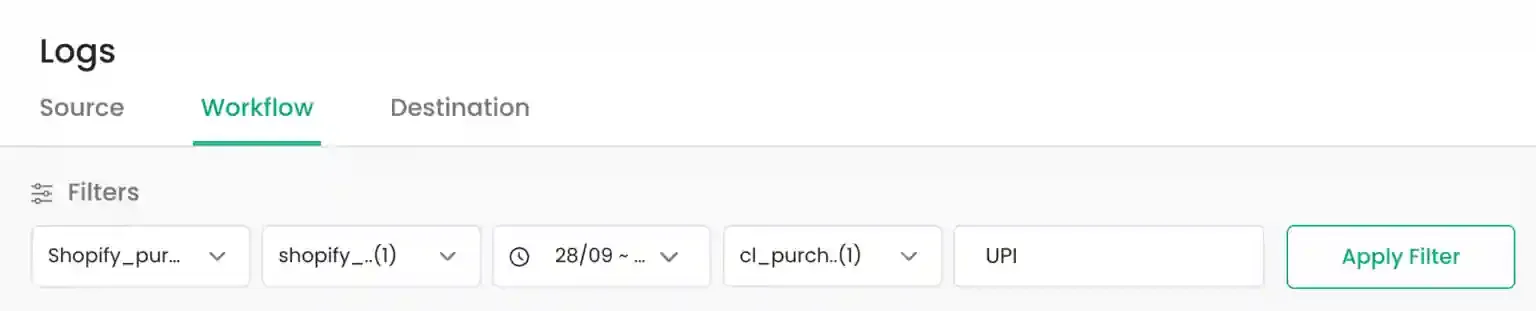
- In the Search By field, enter
UPIand clickApply Filter.
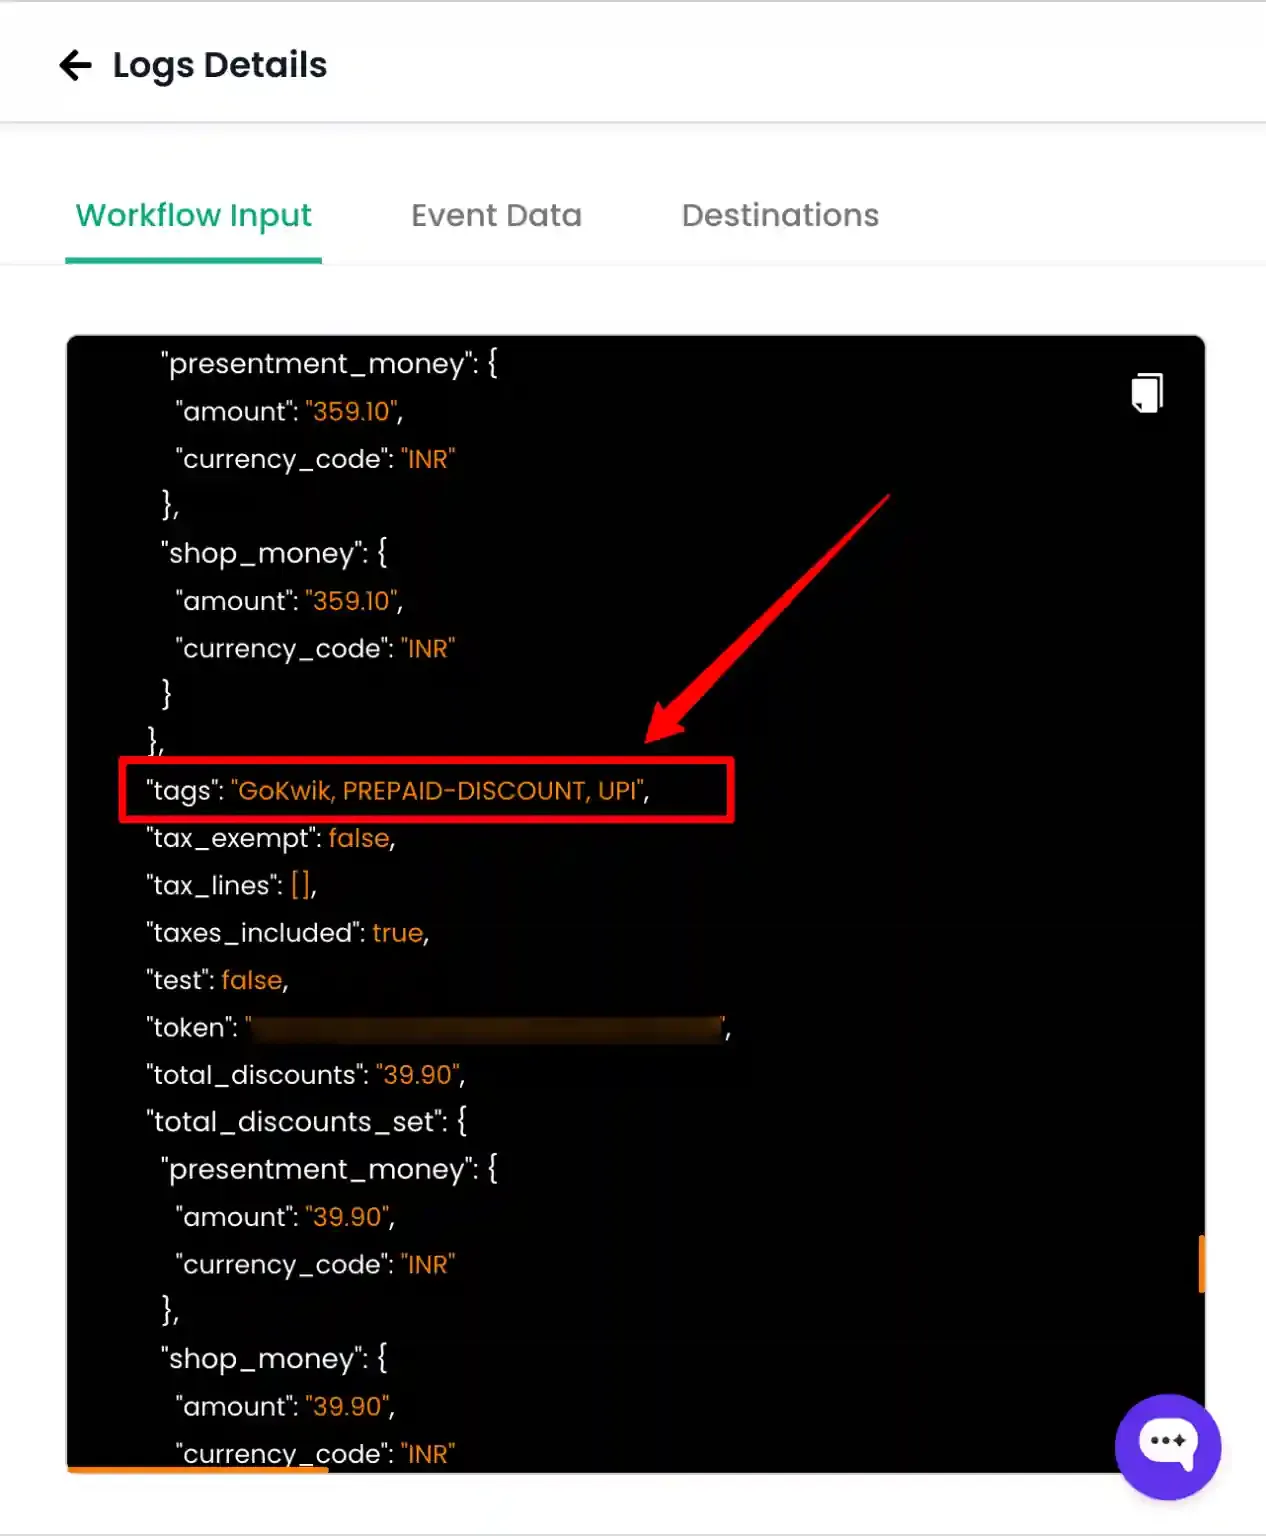
- Click on the
View detailshyperlink and verify the tags in the Workflow Input tab.