Destination Logs – View the event data sent to Destinations
The Destination Logs provide a comprehensive view of event data, offering insights into the status and processing specifics of data sent across various integrated destinations. Use this dashboard to track data transmission, facilitate informed decision-making, and troubleshoot integration issues.
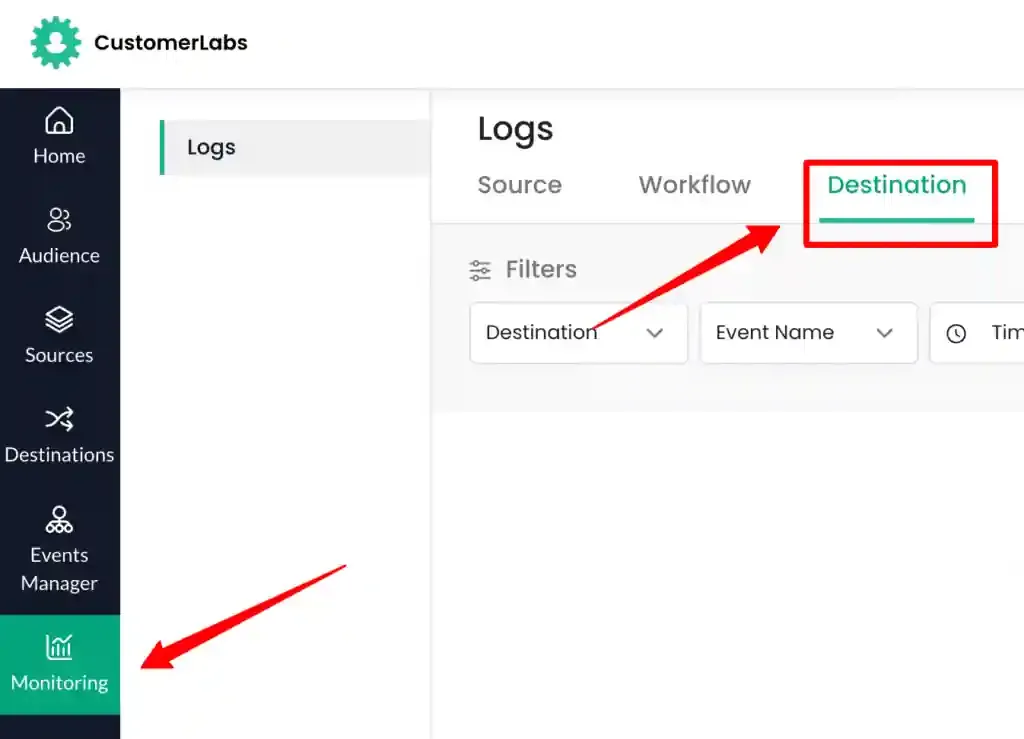
Accessing Destination Logs
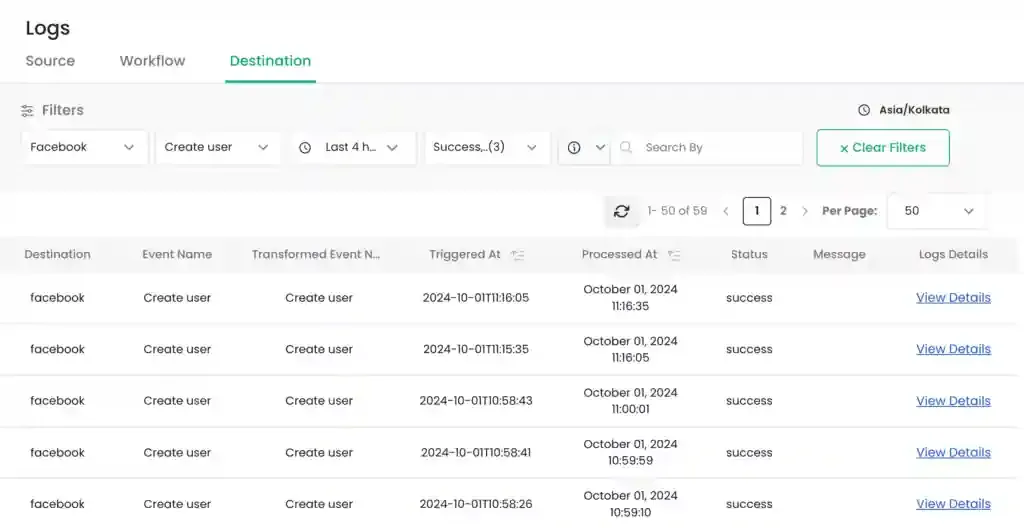
Section titled “Accessing Destination Logs”Navigate to Monitoring → Logs → Destinations to access the logs for all connected destinations.
The dashboard displays the connected destinations to which event data is being transmitted.
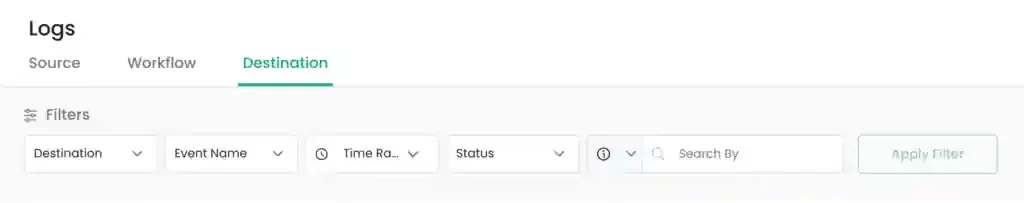
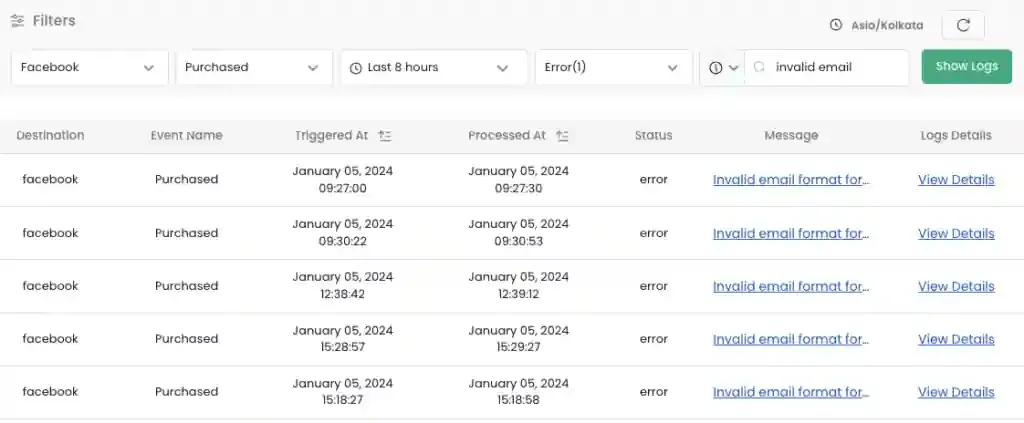
To refine the log data visible on the dashboard, configure the following filter criteria.
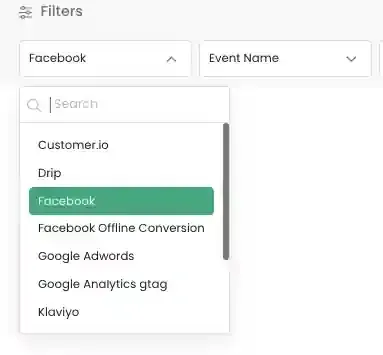
- Destination Filter: Choose a specific connected destination from the dropdown list.
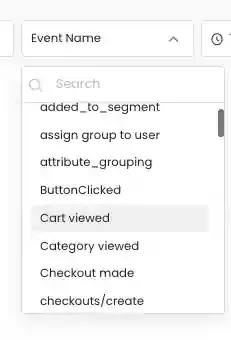
- Event Name Filter: Select the specific event you wish to track from the list of tracked events.
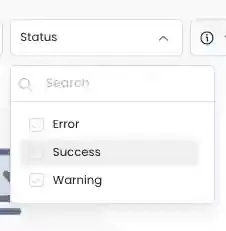
- Status Filter: Filter logs by their transmission status:
Success: Data successfully sent to the destination.Failure: Data failed to reach the destination.Warning: Data sent in a non-standardized format.
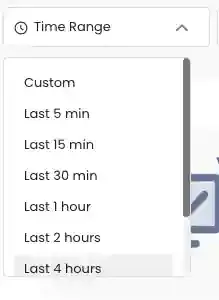
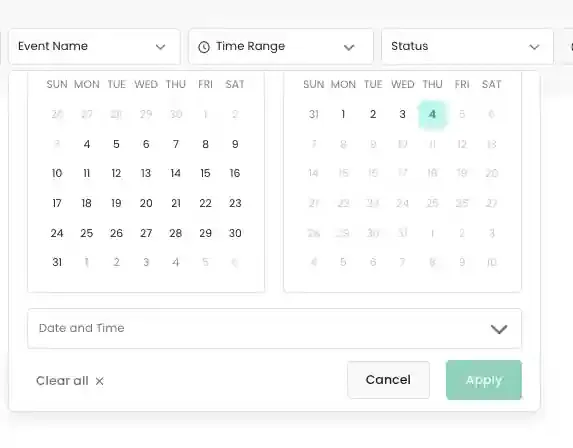
- Time Range Filter: Select a relative time frame (e.g.,
Last 5 min,Last 4 hours) or a custom date range.
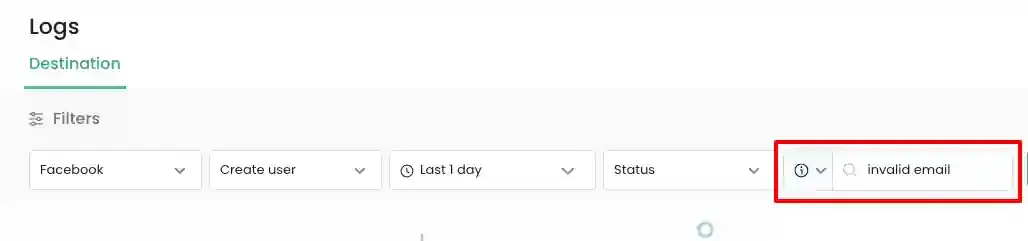
- Search By Filter: Use this input box for granular troubleshooting.
- Select a field:
Error message,Event data,Event ID, orDestination Requested data. - Enter specific search terms (e.g.,
invalid email) in the text box.
- Select a field:
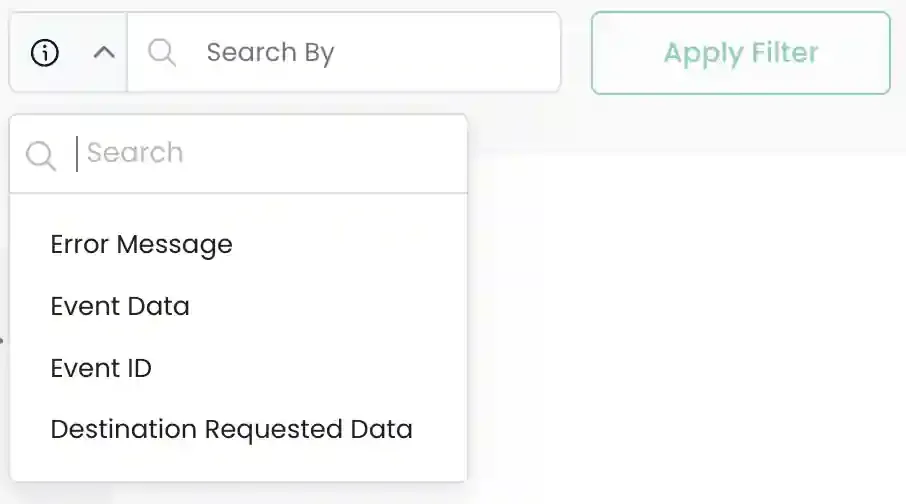
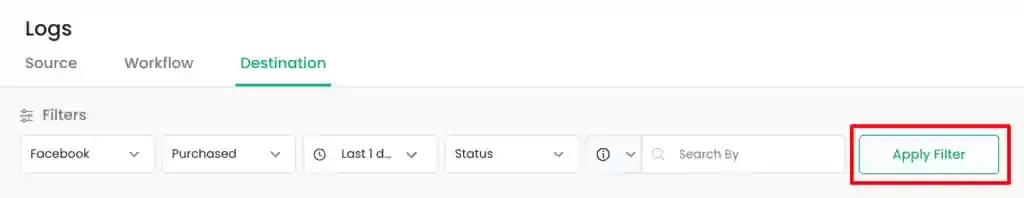
- Apply Filter: Click the
Apply Filterbutton to view the results. This button is enabled only after mandatory fields are selected.
Testing and Validation
Section titled “Testing and Validation”Review the filtered logs to validate the data transformation and transmission process.
Viewing Destination Log Details
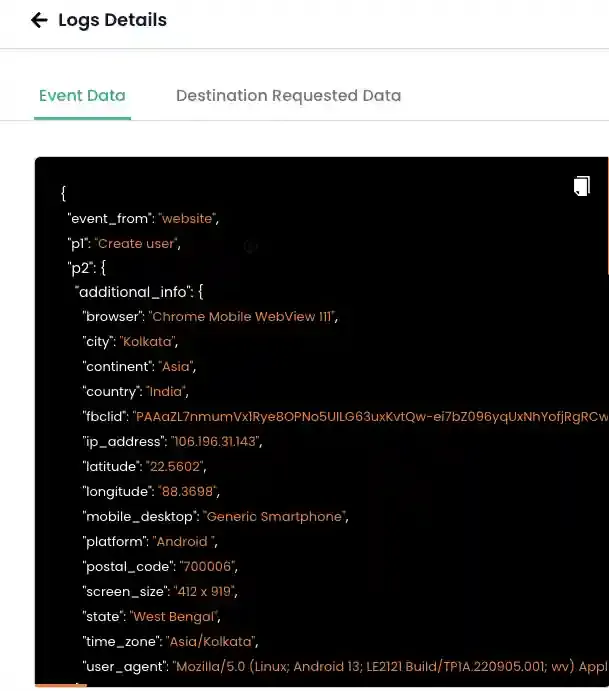
Section titled “Viewing Destination Log Details”Click the View Details hyperlink on a specific log entry to open the side panel containing JSON data.
The side panel provides two views of the event:
This tab displays the raw data as it was processed in CustomerLabs as an event.
This tab displays the data transformed into the specific format required by the destination.
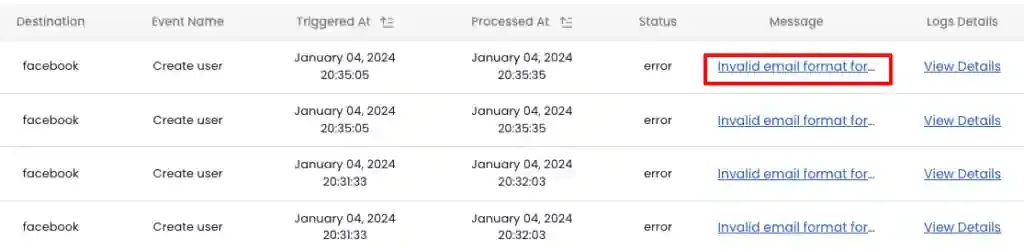
Handling Errors
Section titled “Handling Errors”If an event fails (Failure), an error message link appears. Click the link to view the specific error details in a side panel.
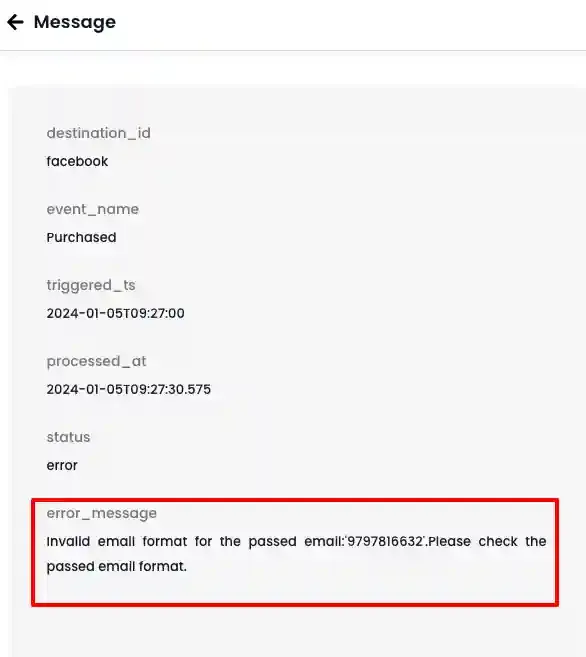
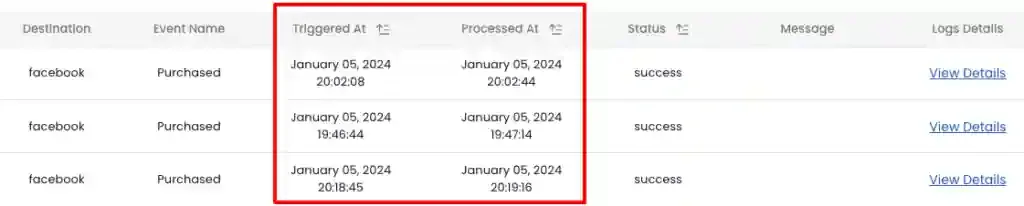
Understanding Process Timestamps
Section titled “Understanding Process Timestamps”Triggered At: The timestamp when the event was initiated from CustomerLabs.Processed At: The timestamp when the event successfully reached the intended destination.
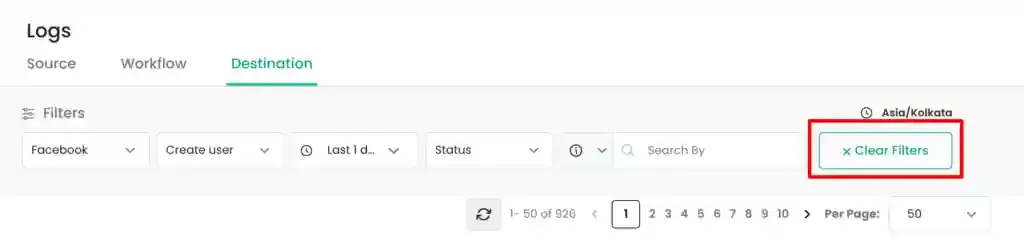
Refresh and Clear Filters
Section titled “Refresh and Clear Filters”-
Refresh Logs: Click the refresh icon to fetch the most recent data based on current filter settings.
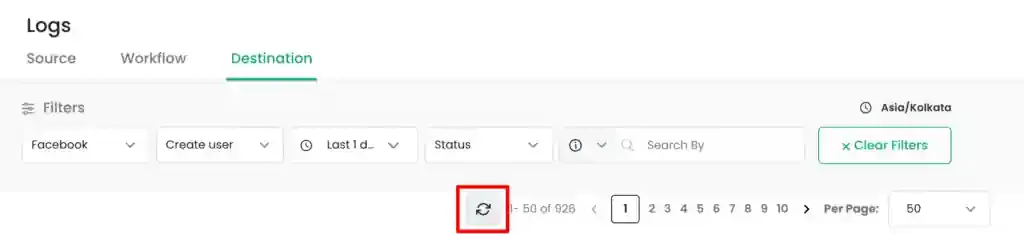
-
Clear Filter: Click the clear filters icon to reset all fields to their default state.
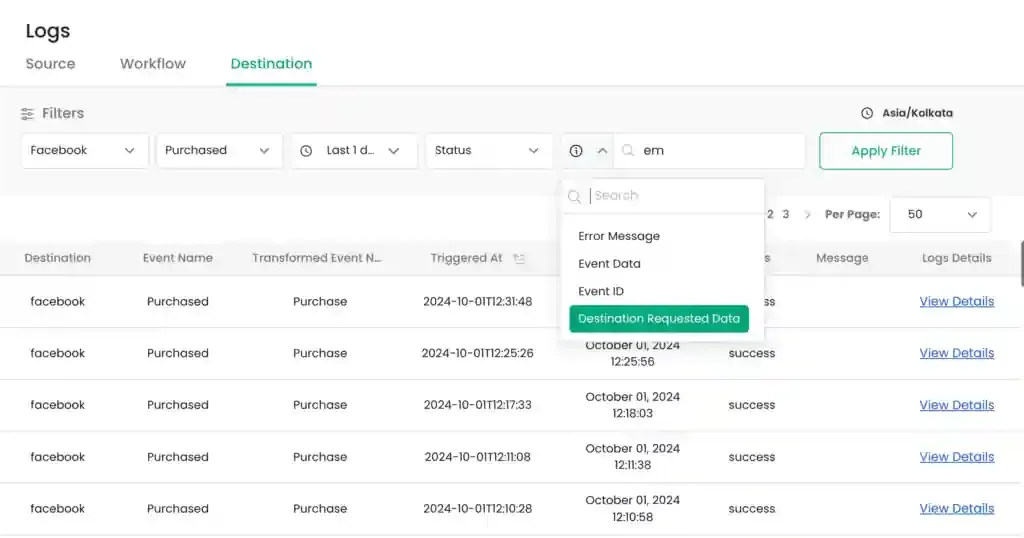
Quick Example: Verifying Facebook Purchase Parameters
Section titled “Quick Example: Verifying Facebook Purchase Parameters”To check if the user trait email was sent to Facebook in the last 24 hours:
-
Select
Facebookfrom theDestinationdropdown.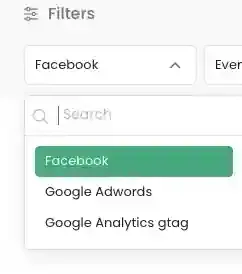
-
Select
Purchasefrom theEvent Namedropdown.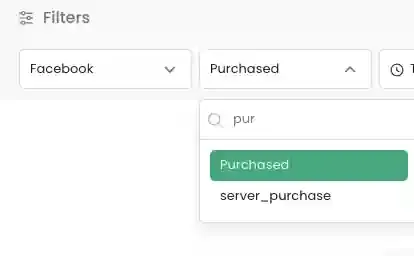
-
Set the
Time rangetoLast 1 day.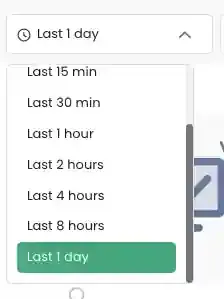
-
Click
Apply Filter.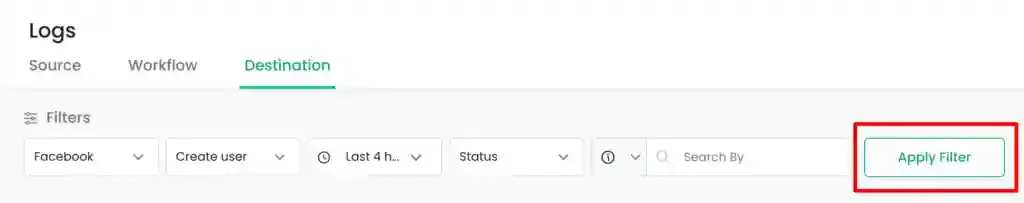
-
Click
View detailson a log entry.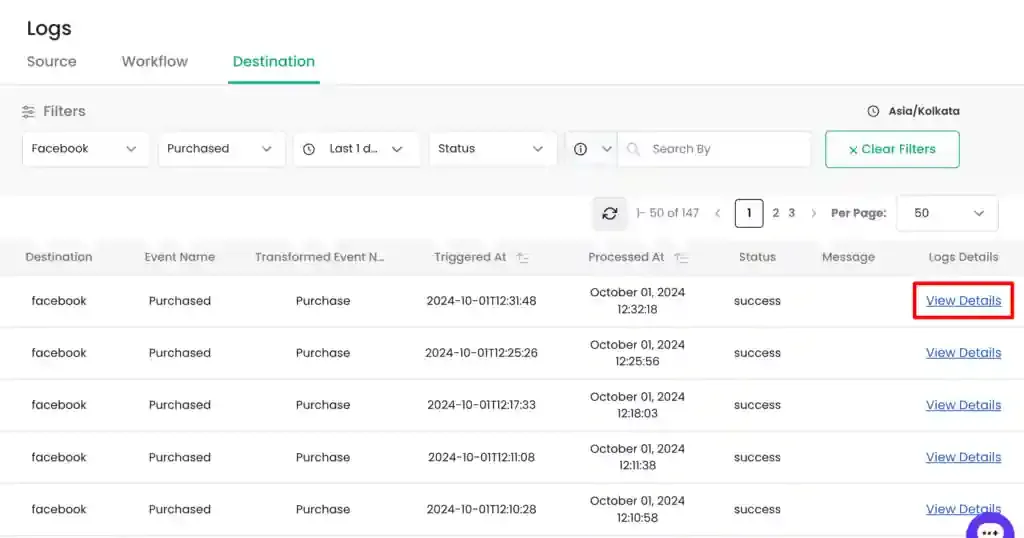
-
In the
Destination Requested Datatab, verify the presence of theem(email) parameter.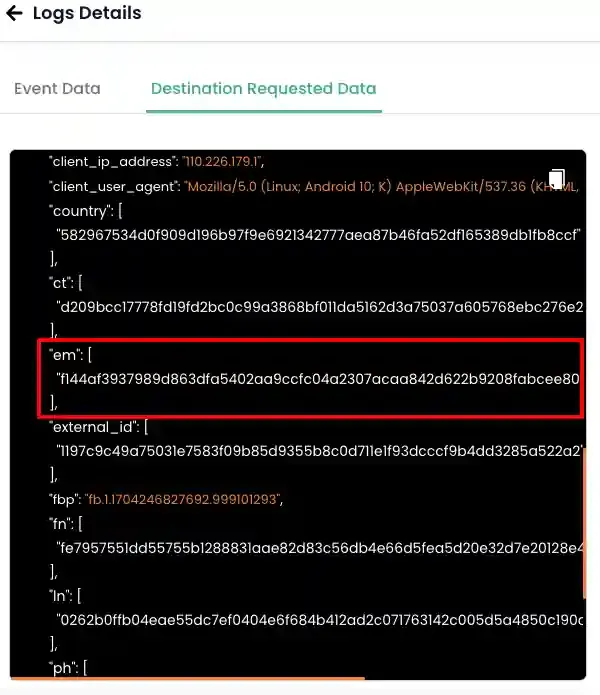
Alternatively, select Destination Requested Data from the Search by dropdown and enter em to filter logs containing the parameter.