Customerlabs CDP Documentation
Destination Logs
The Destination Logs provides a comprehensive view of logs for the event data, offering insights into the status and processing specifics of data sent across various integrated destinations.
The Dashboard allows you to efficiently track the status of data transmission to different destinations using various filters, facilitating informed decision-making and troubleshooting when necessary.
Accessing Destination Logs
You can access the destination logs by navigating to Monitoring → Logs → Destinations.
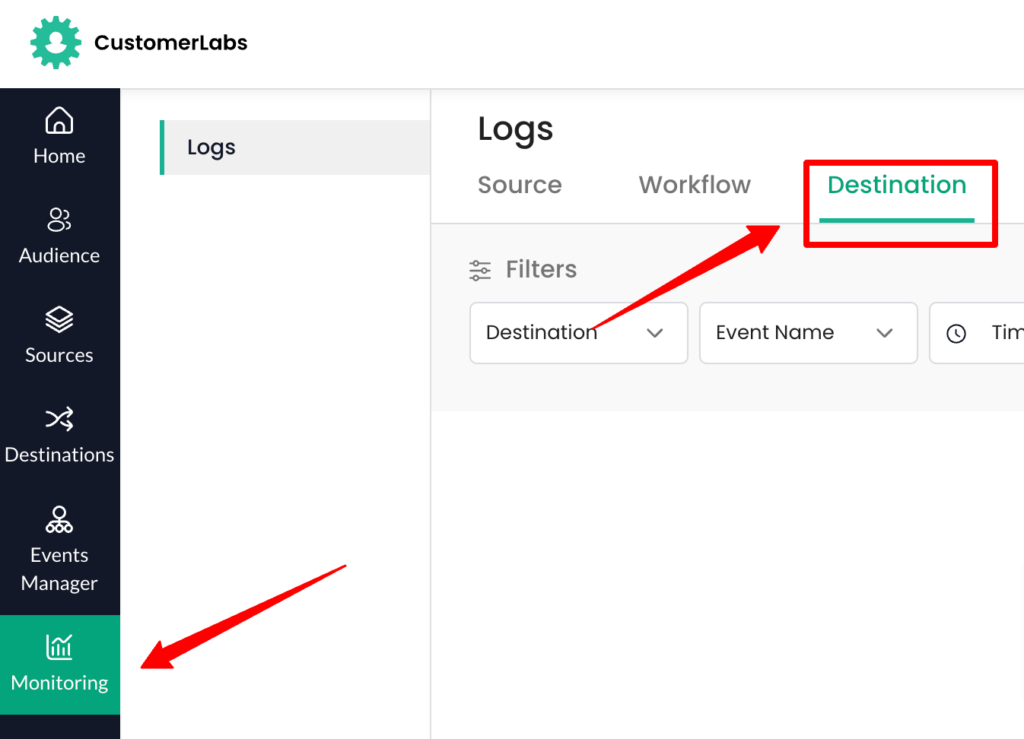
You can view the logs of the connected destinations to which the data are being sent.
To view a particular destination log, you have to apply specific mandatory filters such as Destination, Event Name, and Timerange.
Once you apply the necessary filter criteria and click on the “Apply Filter” button, the destination logs corresponding to the specified criteria become visible.

Filter Options
Destination filter
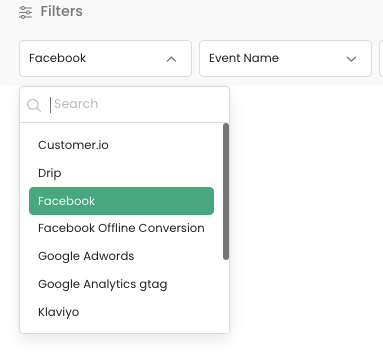
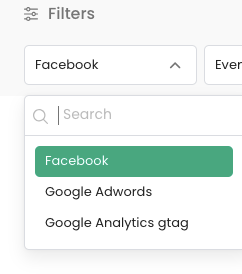
In the “Destination” dropdown, all the connected destinations will appear in the dropdown. You can choose a specific destination from the list to view the log data.
Events Name Filter
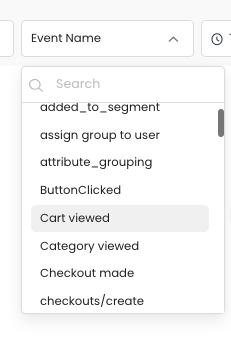
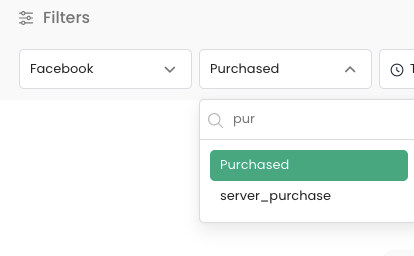
In the Event Name dropdown, it will show the list of events tracked. You can filter the specific event among the list of events to view the log.
Status Filter
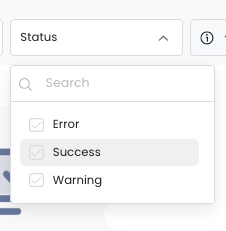
The Status dropdown has three options: “Success”, “Failure”, and “Warning” (indicating data that hasn’t been sent to the destination in a standardized format).
This filter provides you with the ability to view the logs based on the status of data that are being sent.
Time range Filter
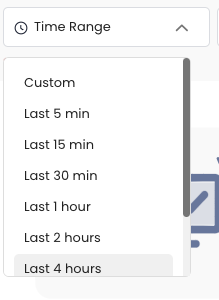
The Time range filter lets you filter and view the logs for a selected time frame.
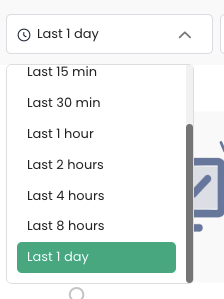
You can filter the data in relative time up to minutes (e.g., last 5 min, last 4 hours, etc.)
Also, custom time and date range can be chosen to filter the logs data.
Note: The custom range and relative times are applied in the “Triggered At” time.
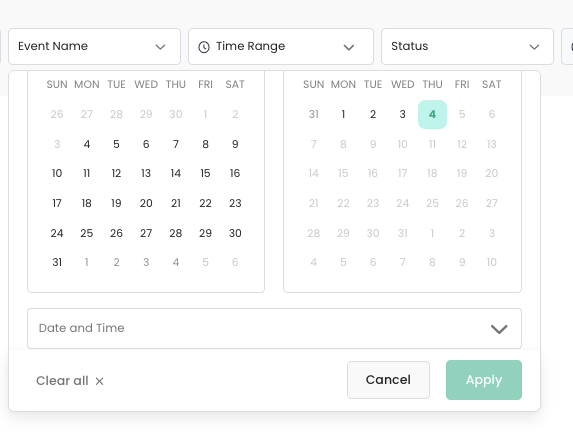
The logs are available only for the last 28 days, and the date can be chosen within this timeframe. However, within this range, log filtering is limited to any 3 consecutive days.
Search By Filter
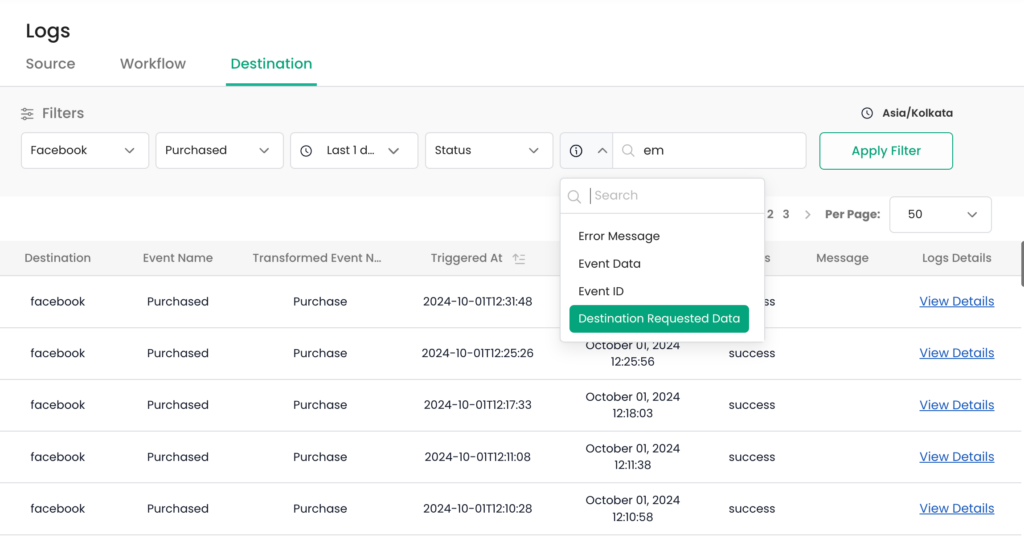
The Search By is an input box that allows you to filter the specific Logs and troubleshoot it.
You can filter the logs by fields:
- Error message
- Event data
- Event ID
- Destination Requested data
Choose a field in which you want to find the specific data.
And then search for specific data that you want to view by entering it in the text box.
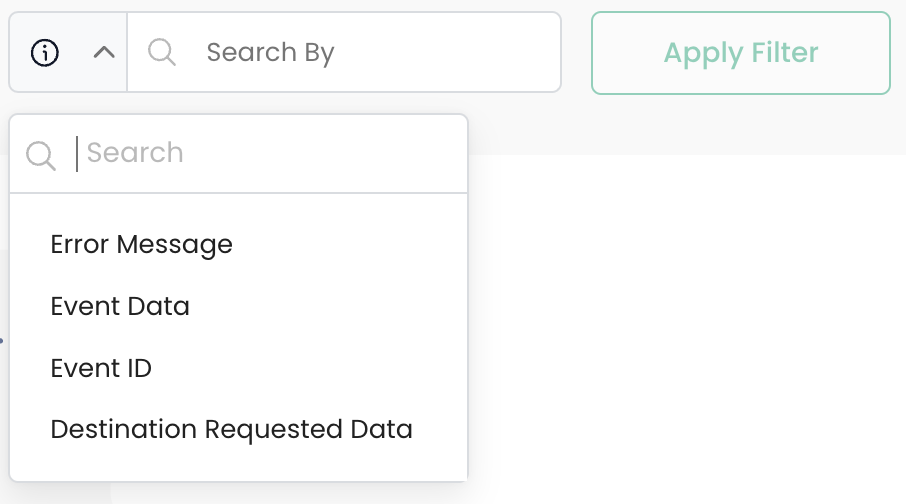
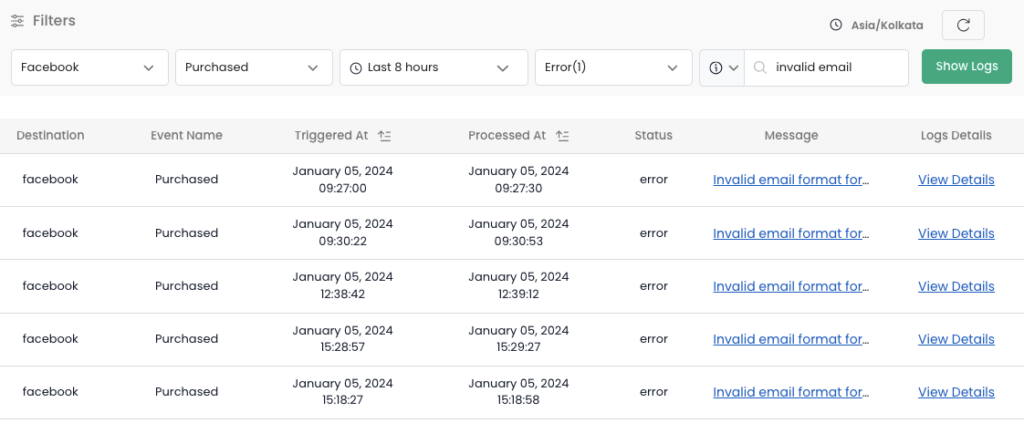
For instance, you can filter logs that has the error ’email invalid’ to view all corresponding logs.
- Select the “Error Message” field from the dropdown
- Input the text – “invalid email” in the text box → “Apply Filter”


Viewing Destination Logs
Once you apply the needed filters to view the logs, then hit the “Apply Filter” button to view logs.
Ensure that the mandatory fields, such as Destination, Event Name, and Time Range filter are chosen to enable “Apply Filter”.

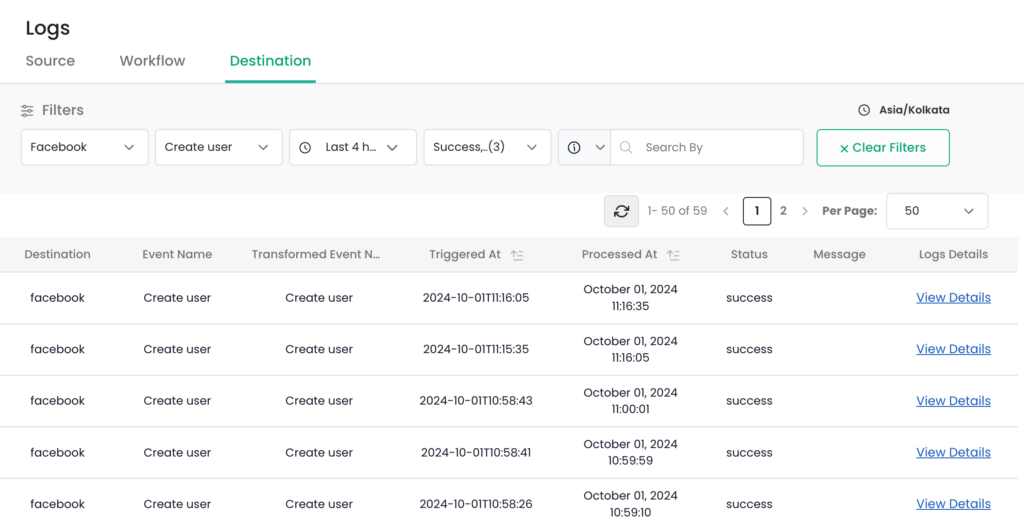
Destination Log Details
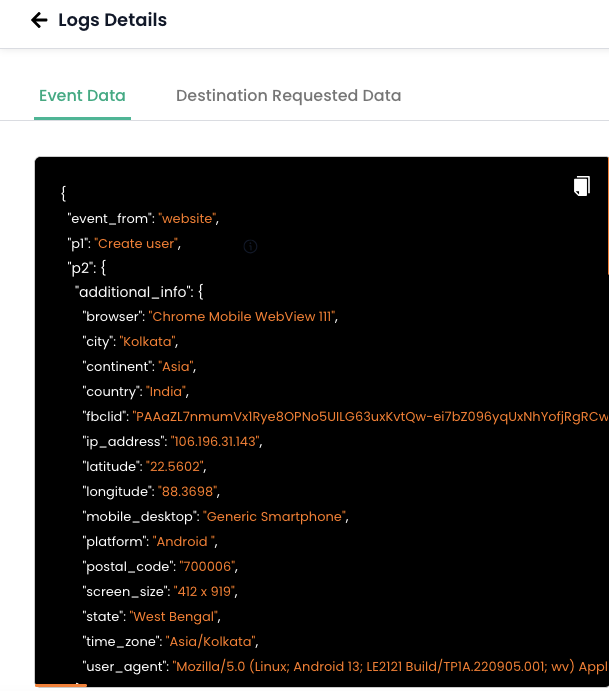
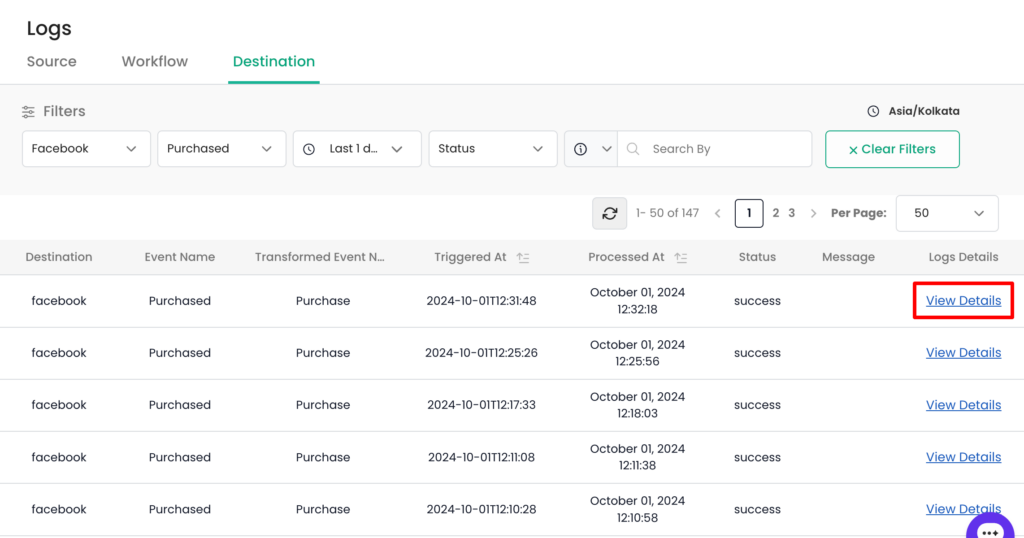
For viewing specific Log details, “View Details” hyperlink button is provided that unveils a side panel presenting the JSON data.
The side panel has two tabs, Event data and the Destination Requested data in JSON format.
The Event data is the data that has been processed in CustomerLabs as an event while the Destination Requested data refers to the data that has been transformed into the format as per the destination.
Error message
If an event fails to be sent to the destination, an Error message appears for the “Error” events.
To access the details of the error, click on the hyperlink to view the error details.
This action opens a side panel where the details of that error are displayed.
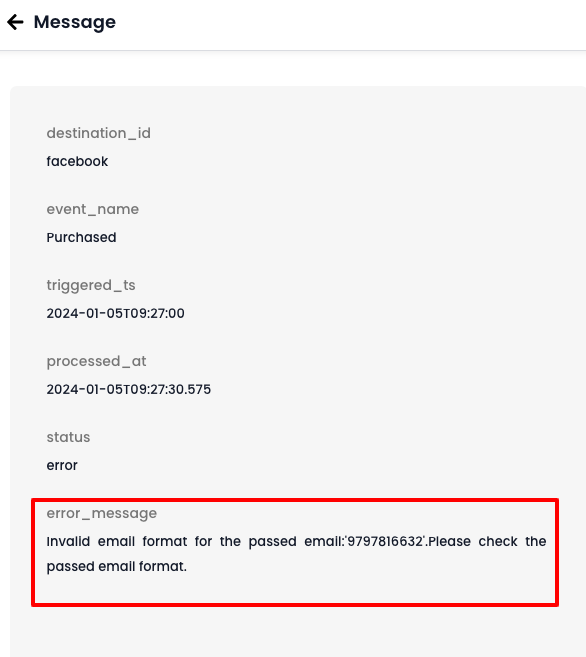
“Triggered At” and “Processed At” refer to specific timestamps related to the processing of an event:
- “Triggered At” represents the time when the event was triggered or initiated from CustomerLabs.
- “Processed At” represents the time when that event was successfully processed to reach its intended destination.

Refresh Logs
Click the refresh button to view the most recent data based on your filter settings.

Clear Filter
You can reset the applied filters by clicking on the “Clear Filters” icon. This action clears all the filters, returning them to their default state, and allowing you to apply new filters.

Quick Example
Say, you want to check whether the user trait “email” has been sent to Facebook in the last 1 day or not.
Steps to find out this using Destination Logs:
1. Select Facebook from the “Destination” dropdown.
2. Select “Purchase” from the “Event Name” dropdown
3. Select the time range as Last 1 day
4. Click on “Apply Filter” button to view the logs.

5. Click on “View details” hyperlink to view the details of the log.
6. Now, in the “Destination Requested Data” tab, you can see all the parameters for the Purchase event that are sent to Facebook.
There you can check whether the parameter (em – email) has been sent.
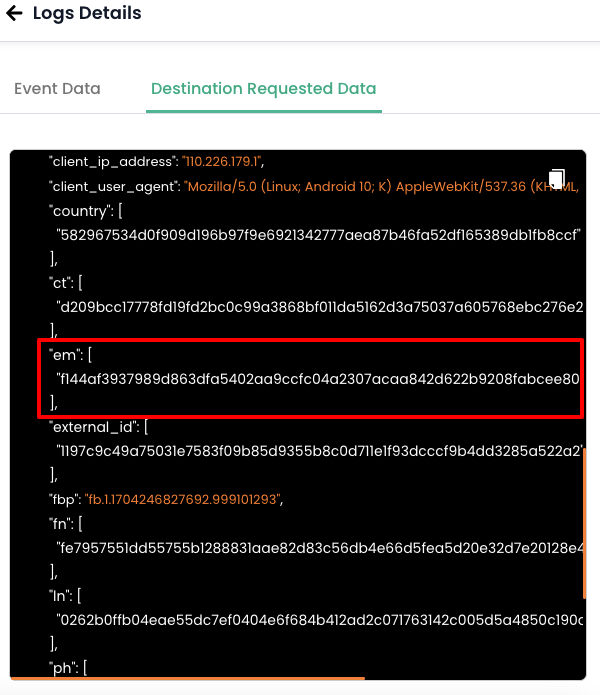
Alternatively, you can search by choosing “Destination Requested Data” from the “Search by” dropdown and enter “em” in the text to filter and see the logs that contain the “email” parameter.
Other Use Cases
- If you encounter event match quality is poor on Facebook for any event such as purchase, product_viewed, etc, you can use the destination logs to examine. This will enable you to verify which parameters were not sent to Facebook, or what error contributed to the poor event match quality.
- If you come across any discrepancies in purchases, such as observing 100 total purchase events captured on Facebook while your records in CustomerLabs indicate 140, utilize destination logs to investigate and troubleshoot the reasons behind the discrepancy in the number of events sent to Facebook.
