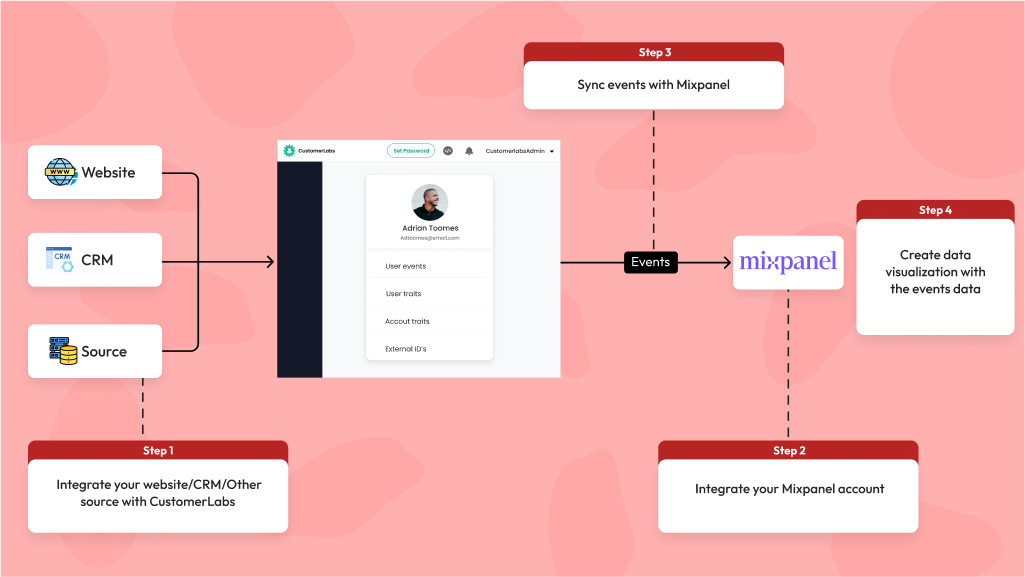
By using the Mixpanel integration with CustomerLabs, you can analyze your website visitors’ data with powerful data visualization to gain insights and improve your conversion rates accordingly.
The Blueprint

The 6 steps involved in this process are as follows,
- Integrate your website, CRM, or other custom source with CustomerLabs 1PD Ops to bring in the data
- Connect your Mixpanel account as a destination with CustomerLabs
- Setup relevant events that will help you uncover your users’ journey
- Sample of e-commerce events could be Viewed a product category – Viewed a specific product – Added a product to cart – Initiated a checkout – Visited the upsell page – Made a purchase
Sample B2B events could be Viewed features — Explored SaaS solution — Downloaded Playbook — Viewed Demo — Viewed Pricing
- Sync these events with Mixpanel destination
- Create funnels in Mixpanel depending on your use case to create visualization and analyze the conversions.
The Process
Step 1: Integrate CustomerLabs 1PD with your website, CRM or other sources
Integrate your website or CRM with CustomerLabs without writing any code following the step-by-step procedure for the integrations.
This will enable us to track user behavior data on the website (online events) as well as bring in CRM information (offline events) such as lead stages, shopping preferences, other user details and much more to combine them using our advanced ID resolution system.
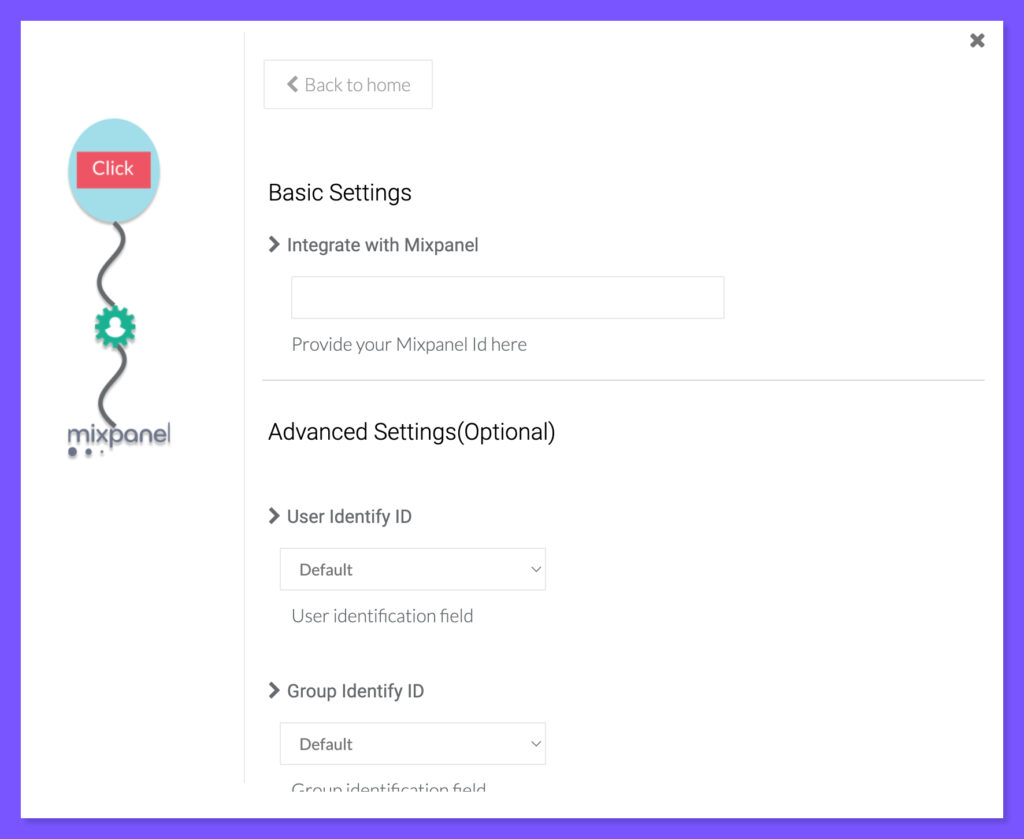
Step 2: Connect your Mixpanel account with CustomerLabs as a destination
The next step is to connect your Mixpanel account with CustomerLabs by navigating to Destinations → Mixpanel → Enable → Setup the Configuration
Refer this guide for Mixpanel integration setup

Step 3: Setup events and sync with Mixpanel
After connecting your website/other source and Mixpanel with CustomerLabs, you will have the events tracked inside CustomerLabs. You can also setup custom events within CustomerLabs to track a specific user journey.
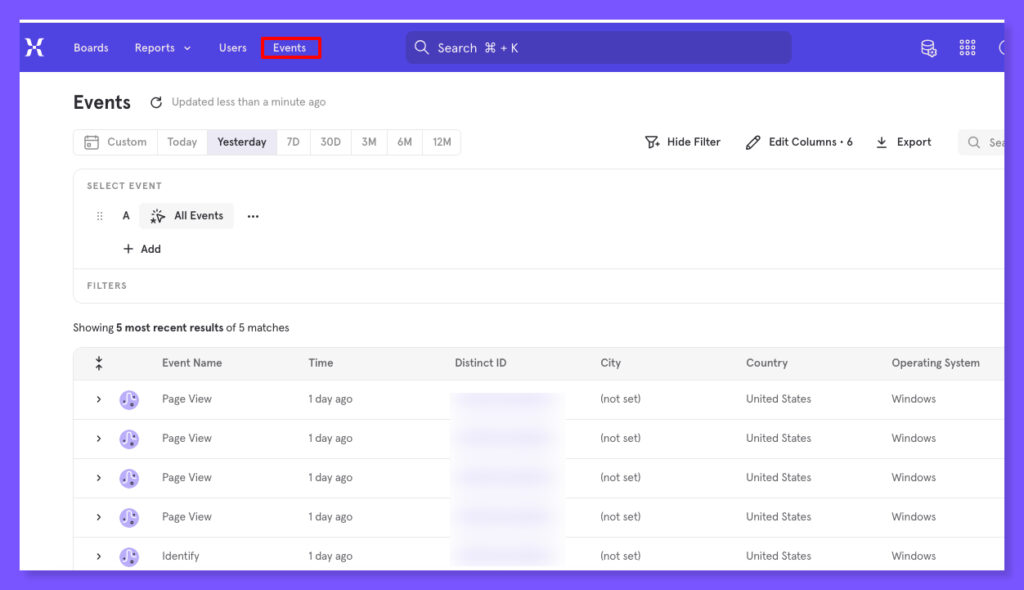
After setting up the events, sync these events with Mixpanel using Event Workflow Setup in the Mixpanel destination.
The events can be viewed in your Mixpanel dashboard ready for your analysis.

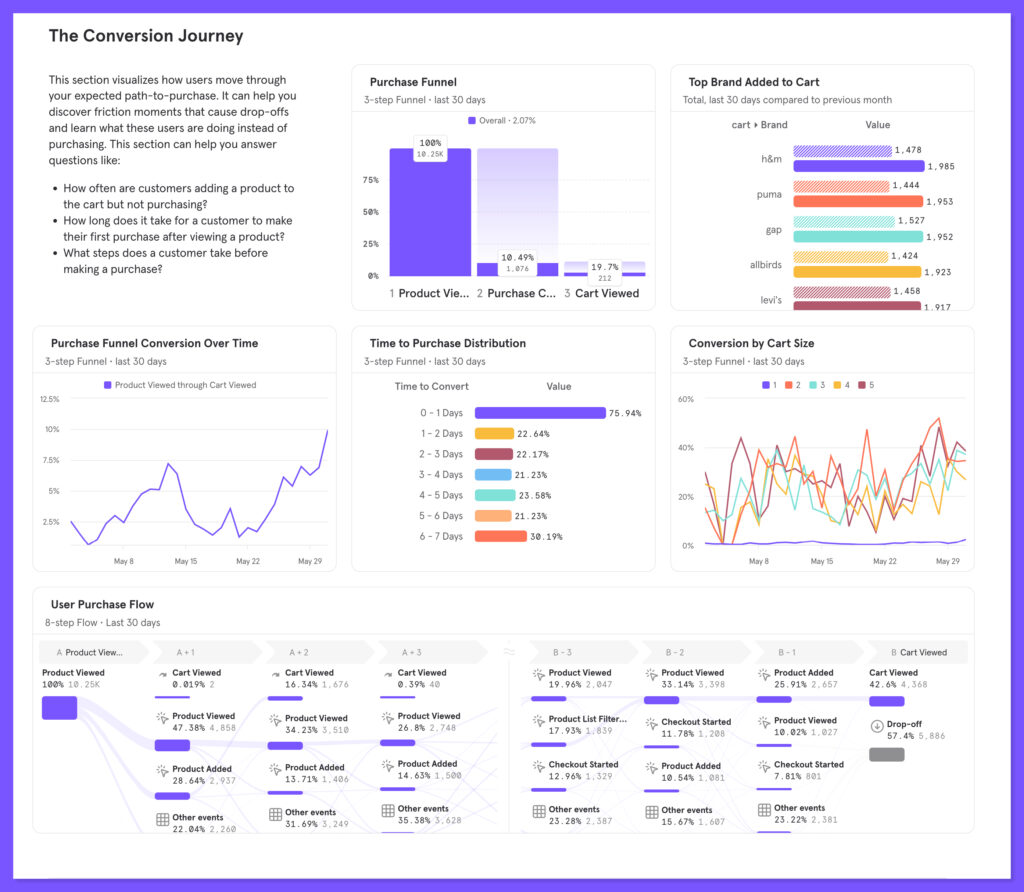
Step 4: Create funnel or flow reports in Mixpanel for data visualization
In Mixpanel, you can setup the funnel report with measurement, breakdown and visualization criteria using the events received from CustomerLabs. This data visualization helps you to analyze the conversion rate of the users across different events to identify the frictions in the path and rectify them to improve the conversions.

Advantages
- Use data visualization to identify the bottlenecks in th user journey
- Improve conversion rate by analyzing your data and rectifying the frictions for the user on your website.


