A little while ago I fell into a thread on r/FacebookAds titled “The real reason ROAS drops when catalogs scale.”
Quick answer: Your early ROAS was never spread evenly across products, it was carried by a handful of hero products. Scale the budget and it flows into weaker categories too, so the blended number drifts down toward your true catalog average. The account didn’t break. The average just stopped hiding your weaker products.
The usual suspects, creative fatigue, the algorithm, rising costs, aren’t wrong, but they’re not the real lever either. Read on for how to see exactly where the drop is coming from, and fix it.
But the thread’s real point is sharper than any of those, and it’s the reason for this whole article: the strong early ROAS was never spread evenly across your products. It was being carried by a handful of hero products.
The single ROAS figure was never telling you where performance actually came from. And the moment you scale, it starts costing real money.
So let’s first understand clearly about that single blended ROAS.
First, What Is Blended ROAS?
Quick definition, because a lot of teams use the term loosely.
Blended ROAS is your total revenue divided by your total ad spend across the entire account, one number for everything you’re running. Every category, every region, every product, new and returning customers, all averaged into a single multiple.
Say you spent $20,000 on ads across Meta, Google, TikTok and other channels in a month. Those campaigns generated $100,000 in revenue.
So the formula goes like this, Blended ROAS = Total Revenue ÷ Total Ad Spend
Blended ROAS = $100,000 ÷ $20,000 = 5x
On paper, a 5x ROAS looks fantastic.
But that $100,000 in revenue and $20,000 in spend didn’t come from one place. Say it broke down like this:
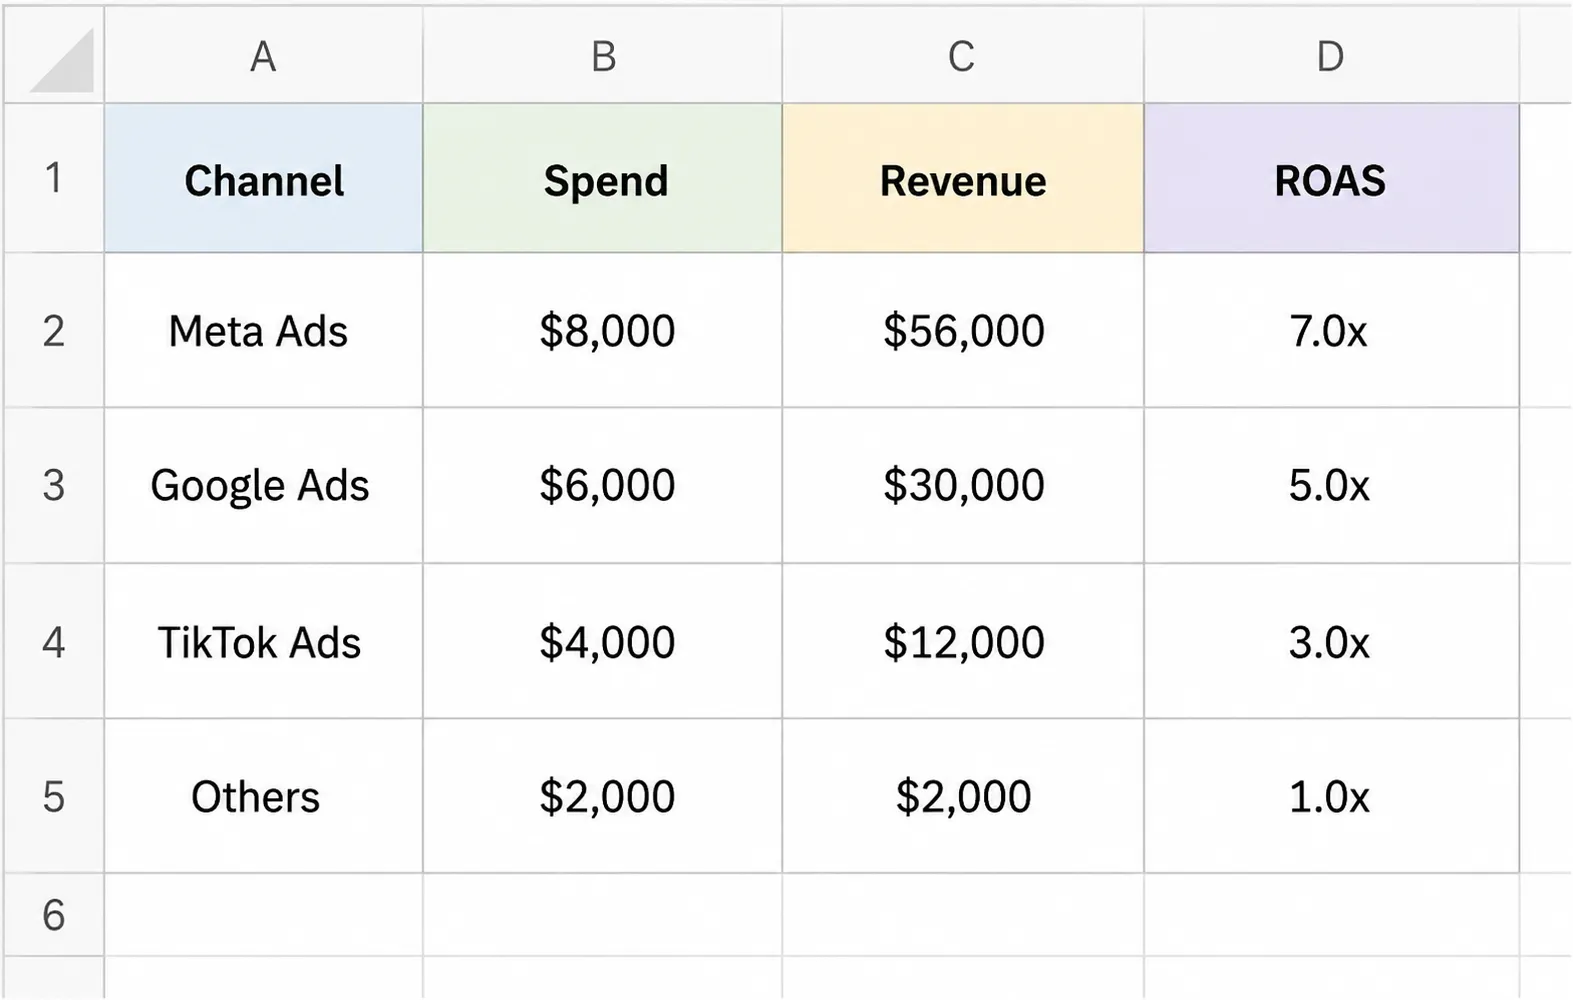
When you break it down, you can see from the above table that TikTok is barely justifying its spend, and “Other” is returning exactly what went in, no profit at all. The 5x never lied, exactly. It just never mentioned that a fifth of your budget is dead weight being carried entirely by Meta.
Now stretch that across categories and regions inside a single platform, instead of across four different ones and you’ve got the exact problem this article is about.
A blended ROAS can look very healthy and still be manipulative, hiding wasted ad spend underneath it. This post is about how to see it, and fix it.
Why Do Brands See Category Performance and Regional Spend Separately?
Almost every brand analyzes Meta performance through two reports that never actually meet.
The first is the category (or product) report: spend, revenue, sales, ROAS, CPA and CPC for each category. It’s how you know running shoes return well and a particular line runs thin.
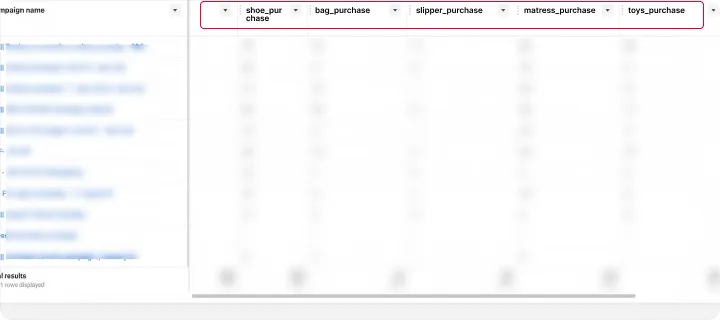
The second is the regional report: spend by state or region, and each region’s share of the budget. It’s how you know one or two states dominate the account.
Both are useful on their own. Neither can answer the question:
“Which product category is receiving how much money, in which region?”
You might know your top category generates strong ROAS. You might also know California takes the biggest share of spend.
But do you know how much of that category’s budget is landing in California or how much of a weak category is concentrated there?
The category report and the regional report each hold half the picture. And that’s exactly where blended ROAS hides wasted ad spend.
Why Blended ROAS Blind Spots Waste Ad Spend
When you can’t see category performance and regional spend together, you end up doing some version of the following:
- Pouring more budget into a category with weak ROAS, because at the blended level it looked fine.
- Cutting a strong category because its total budget looked high, without noticing that budget was earning.
- Running identical creative across regions with genuinely different tastes, sizes and inventory.
- Letting two categories compete for the same audience and bid up each other’s costs.
- Starving a strong category that never got enough budget to prove itself.
- Reallocating budget with total confidence in the wrong direction.
Your campaigns may be well-built and well-run. But the problem is that you can’t see where performance is coming from, and invisible structure produces confident mistakes.
Want to see how much of your Meta spend can’t be traced to a product? Book a 20-minute audit and map your account by category and region.
If you would like to do it yourself, look for the signs down below.
How to Identify That Your Ad Account’s Blended ROAS Is Hiding Wasted Ad Spend
Open your meta ads manager and check these:
- Your ROAS looks good, but scaling drags ROAS down. That signifies budget flowing into categories or regions that can’t absorb more, not the account “topping out.”
- One or two categories eat most of the budget, and you can’t confirm whether they’re the most profitable, or just the easiest for Meta to spend on.
- Meta keeps scaling a weaker category. Sales grow, so it feels like a win, but that category’s ROAS sits below the account average. The platform is scaling volume, not margin.
- Your best categories are tiny. A category posts excellent ROAS and CPA but never got the budget to prove it can scale, so it stays small and invisible.
- A big chunk of spend has no product-level attribution. Revenue shows up, but you can’t tie all the ad spend back to specific SKUs or categories.
If several of these ring true, the issue almost certainly isn’t your campaigns. It’s your visibility, and the fix starts with breaking blended ROAS apart.
5 Reasons Blended ROAS Hides Your Real Product-Level ROAS
There are five common, compounding causes behind the gap.
1. Blended reporting averages your winners and losers. A 3.84x account ROAS might contain one category at 5.50x, another at 3.36x, and another at just 2.56x. The blend looks healthy and gives you no way to tell them apart, so the 2.56x category keeps getting funded.
2. Product IDs are missing or mismatched. This is the mechanical root of most wasted, invisible spend: content_ids missing from events, website product IDs that don’t match catalog IDs, purchase events firing without product details, non-catalog campaigns that never expose product data, and dynamic vs. non-dynamic ads using different identifiers. When any of these break, part of your spend can’t be traced to a product at all, and ongoing browser and privacy signal loss only widens the gap. (This is exactly what server-side tracking with the Conversions API is meant to fix.)
3. The platform spends more when it sees more clicks, more purchases, or a lower short-term CPA. What it can’t see is your product margin, stock, return rates, category priorities, regional inventory, or new-vs-returning customers. It optimizes for measurable events, which is not the same as optimizing for profit.
4. Regions are managed as a separate problem. Categories and regions get tuned in different meetings and never connect product demand, regional spend, creative relevance, inventory and pricing into one view.
5. Decisions rest on too short a window. One or two days can reveal a pattern but can’t confirm one. Scaling or cutting on a two-day read is how noise gets promoted to strategy.
How To Fix This Gap Via Category & Region ROAS Analysis Together
The fix is to stop reading two separate reports and start reading one grid.
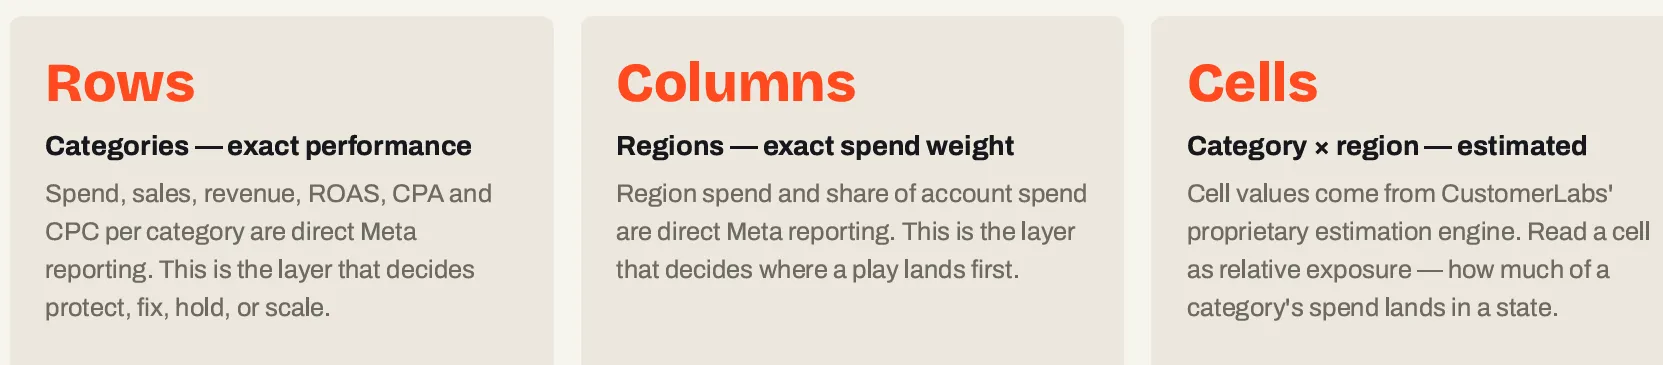
So, when you put it together, it will look something like this:
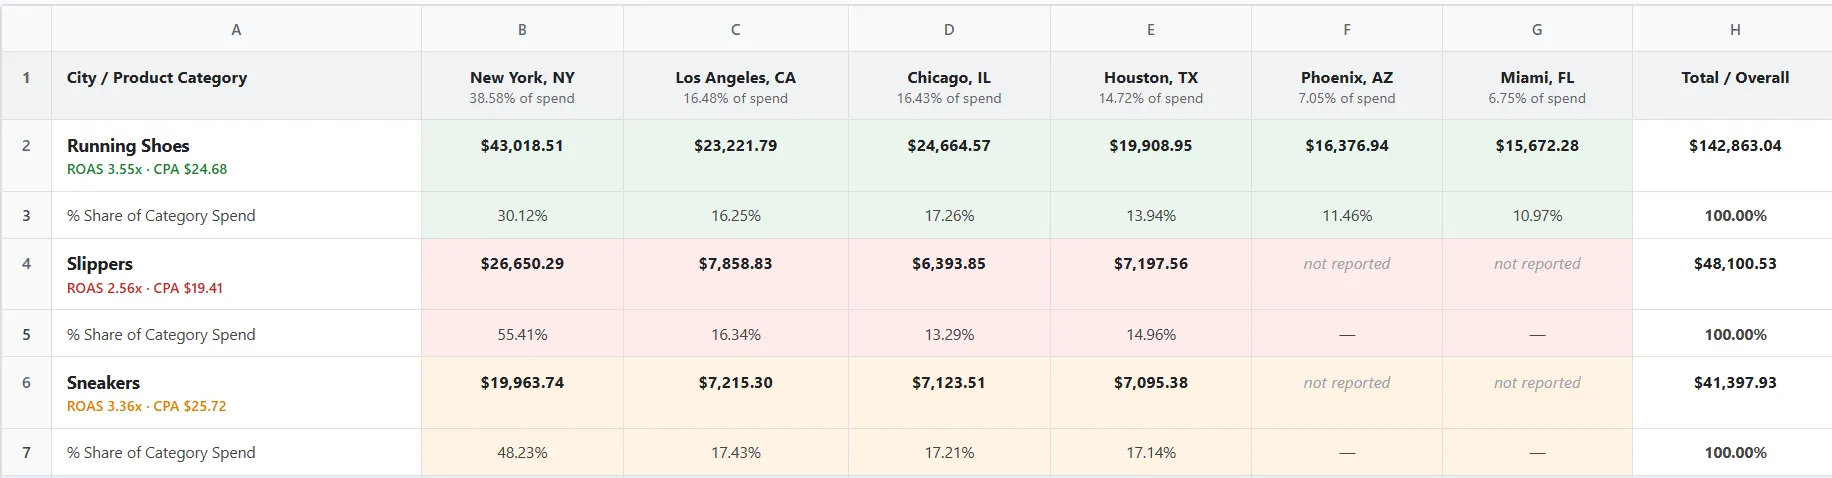
One rule keeps the whole thing honest: read a cell as exposure. Estimated spend, never as region-level ROAS. You judge a category’s efficiency from its row, always.
The cell tells you how much is at stake in a place; the row tells you whether that place is worth leaning into.
Strategize & Build Simple Decision Model
With categories as rows, nearly every decision collapses into four buckets.
- Protect if ROAS is above the account average, meaningful volume, acceptable CPA.
- Maintain budget, protect inventory, refresh creative to fight fatigue, and validate before scaling further.
- Fix before scaling, if sales are growing, but ROAS below target and CPC or CPA rising.
- Remove weak SKUs, improve the product mix, review landing pages, check pricing and inventory, and resist adding budget until the return holds.
- This is the trap category, growth without profitability, usually because the platform is scaling it for you.
- Hold if performance is fine, not strong enough for more budget.
- Keep the budget stable, improve creative and conversion rate, and stop it from overlapping stronger categories chasing the same audience.
- Controlled scale test, if high ROAS, low CPA, but spend and volume still small.
- Raise budget gradually with a dedicated product set, test in regions that already show demand, and watch whether performance holds as spend grows.
- This is where the hidden winners from that Reddit thread finally get their shot.
The model is simple on purpose. Its value isn’t cleverness, its consistency. Applied to every row, it turns a wall of metrics into a short list of decisions.
Fix Product-Level Attribution Before You Move Budget
Here’s the prerequisite that has to come first, because skipping it invalidates everything after it: your budget decisions are only as reliable as the product data beneath them.
Before you reallocate a single dollar, get honest answers to a short checklist.
- Are product IDs attached to all relevant events?
- Do your website IDs match your Meta catalog IDs?
- Are purchase events sending the right product details?
- Which campaigns are generating unattributed spend, and are non-catalog campaigns the cause?
- Can your backend order data validate Meta’s reported revenue?
- Is margin data available by category?
- And can you break unattributed spend down by campaign and ad set?
If a meaningful share of spend has no product attribution, your matrix can only see part of the account, and a priority map built on a partial view will point you confidently in the wrong direction.
Closing that gap, clean catalog matching, server-side tracking, backend reconciliation, isn’t the boring preamble to the real work. It is the real work, because it decides whether every downstream decision is made on all your data or just the visible slice of it. That’s the core of what CustomerLabs’ first-party data platform does.
Not sure how much of your spend is invisible? Book a demo and we’ll show you your unattributed-spend number in your own account. Most brands are surprised how high it is.

How Category × Region Visibility Uncovered Wasted Ad Spend for This Brand
To see the framework work, here’s a real diagnosis (brand anonymized).
The situation. A footwear brand had a profitable Meta Ads account: strong overall revenue, a healthy blended ROAS, multiple categories, and spend spread across many regions. At a glance, everything looked fine, the exact “the number’s good, move on” scenario this article opened with.
What the analysis uncovered. Rebuilt as a category × region matrix, the account told a different story:
| Category | 2-Day Spend | Revenue | ROAS | CPA | Verdict |
|---|---|---|---|---|---|
| Running Shoes | $3,155 | $11,193 | 3.55x | $6.32 | Protect |
| Slippers | $1,124 | $2,871 | 2.56x | $4.97 | Fix before scaling |
| Sneakers | $1,080 | $3,624 | 3.36x | $6.59 | Hold |
| Training & Gym | $344 | $1,891 | 5.50x | $3.82 | Controlled scale test |
Running Shoes was the strong, high-volume anchor but even here the blend was hiding movement. Protection doesn’t mean “leave it alone”, it means fix the creative fighting rising costs before adding budget.
| Metric | Day 1 | Day 2 |
|---|---|---|
| Spend | — | ▼ 14.28% day-over-day |
| ROAS | 3.62x | 3.46x |
| CPC | $0.043 | $0.051 |
Slippers was the weakest row on the board and the one Meta was scaling hardest. The platform was funding volume, not margin, in exactly the category that could least afford it.
| Metric | Day 1 | Day 2 |
|---|---|---|
| Spend | — | ▲ 11.27% day-over-day |
| Sales | 101 | 125 |
| ROAS | 2.31x | 2.78x |
| CPC | $0.058 | $0.074 |
| Top region cell | $146 | $175 |
Sneakers held steady at 3.36x, but CPA kept climbing while it sat in the same top states as Running Shoes and likely competed for the same buyers. Hold the budget, differentiate the creative, don’t scale until the trend reverses.
| Metric | Day 1 | Day 2 |
|---|---|---|
| CPA | $6.45 | $6.74 |
Training & Gym was the winner never given room to prove itself, the best-performing line in the account was also the smallest and the least visible one, with no regional split reported at all.
| Metric | Day 1 | Day 2 |
|---|---|---|
| ROAS | 5.25x | 5.78x |
| CPA | $4.13 | $3.53 |
| 2-day spend | $344 total (vs. $1,080–$3,155 for the other three) |
One region carried around a fifth of the account’s entire spend, the #1 cell in every mapped category.
| Metric | Value |
|---|---|
| Share of account spend, day 1 → day 2 | 20.05% → 21.05% |
| 2-day spend in this region | $1,902 |
| Running Shoes share of that spend | 27.3% |
| Slippers share of that spend | 16.9% |
| Sneakers share of that spend | 12.6% |
| No category attached | 43.2% |
Nearly 30% of spend couldn’t be connected to any product at all. That means every “protect,” “fix,” “hold” and “scale test” call above was being made on roughly 70 cents of every ad dollar. The other 30 cents were simply invisible.
| Metric | Day 1 | Day 2 |
|---|---|---|
| Spend with no product ID | 29.4% | 30.3% |
What the analysis uncovered. Rebuilt as a category × region matrix, the account told a different story:
- One category was doing strong volume and clearly deserved protection.
- Another had the best ROAS and CPA in the account but received very little budget, a winner never given room to prove itself.
- A weaker category was already being scaled by the platform on volume, not return.
- One region carried around a fifth of the account’s entire spend, the #1 cell in every mapped category.
- Nearly 30% of spend couldn’t be connected to any product at all.
The numbers behind the two-day snapshot:
- $35,566 in Meta-attributed revenue
- 1,744 orders
- 3.84x blended ROAS
- Best major category at 5.50x ROAS, more than double the weakest anchor
- Nearly 30% of spend missing product-level attribution
What this proves (and what it doesn’t). At this stage, the case study shows the framework identified a hidden allocation problem and produced a concrete action plan. It does not claim performance improved after implementation, because those results aren’t in yet. The value here is diagnostic clarity, not a retrofitted win.

How to Find Wasted Ad Spend in Your Own Account
You can start this week, without a big project:
- Review performance by category, not just by campaign.
- Rank categories by ROAS, CPA and sales volume.
- Identify the regions taking the most spend.
- Connect category spend with regional exposure.
- Find your unattributed / missing product-level spend.
- Check product IDs and catalog matching.
- Classify each category as protect, fix, hold or test.
- Validate over at least seven days.
- Move the budget in small steps.
- Watch whether performance holds after scaling.
Blended ROAS vs. Category-Level Visibility: The Bottom Line
The goal was never to chase the region with the most spend or the category with the highest ROAS blindly. The goal is to see four things at once: what’s working, where the money is landing, how much is at stake, and whether the data underneath is even reliable.
A blended number can’t hold all four. A category × region view can and that’s the difference between knowing your account is profitable and knowing your budget is in the right places. It’s also, as that Reddit thread quietly showed, the difference between ROAS that survives scaling and ROAS that falls apart the moment you push spend.
Blended ROAS tells you whether the account is profitable. Category × Region visibility tells you whether the budget is going to the right places.
If a share of your own spend is going invisible, that’s where to start. Book a demo to see your category × region map, or start a free trial and find your wasted ad spend yourself.